AIR Tool | Forecast Datasets
Along with reviewing past conditions and seeing what’s going on right now, the AIR tool also includes several forecast datasets to help you plan ahead.
Air Quality Forecasts
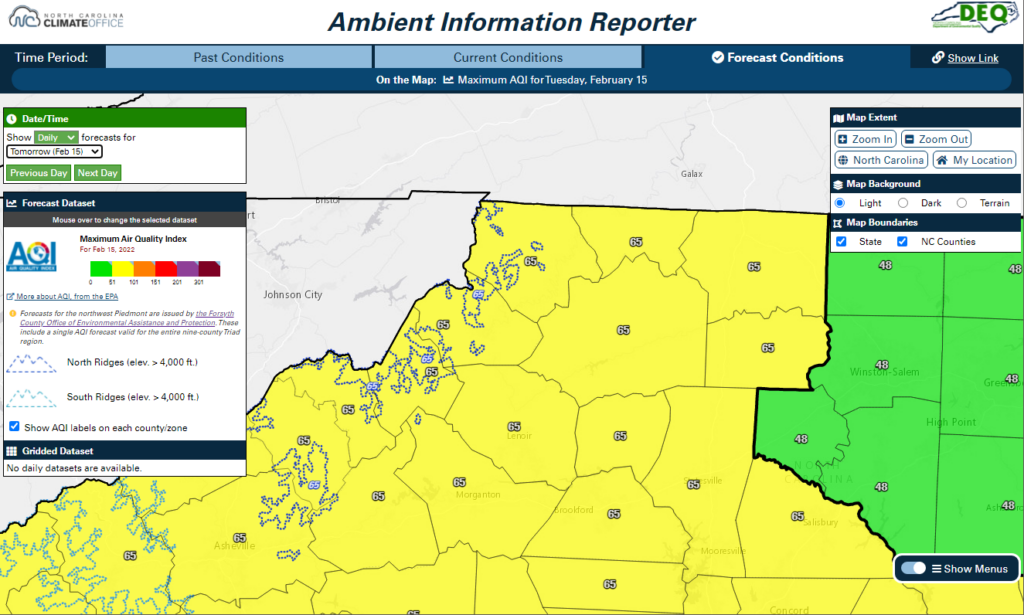
The NC Division of Air Quality issues county-based forecasts each day in North Carolina. These are supplemented by a regional forecast for the nine-county Triad region issued by the Forsyth County Office of Environmental Assistance and Protection. In the Mountains, regions above 4,000 feet in elevation are covered by forecasts for the north and south ridgetops.
Each county or region’s forecast includes the daily maximum Air Quality Index, which is based on the maximum of the PM2.5 AQI and, during the ozone season from March 1 to October 31, the ozone AQI. Each parameter (PM2.5 and ozone AQI) along with the maximum AQI can be selected in the Forecast Dataset menu on the Forecast Conditions tab.
Forecasts are available over the next three days. The forecast date can be changed in the Date/Time menu. Note that forecasts are updated each afternoon by 4 pm. As conditions warrant, morning updates are sometimes made between 10 and 11 am.
Weather Forecasts
Gridded forecasts for several weather variables of interest are also available on the Forecast Conditions tab of the AIR tool. Because these are hourly forecasts, the “hourly” option must first be selected in the Date/Time menu before these options appear in the Gridded Dataset menu.
Weather forecasts available from the National Weather Service’s National Digital Forecast Database include the gridded air temperature, dew point, relative humidity, and cloud cover. When viewing any of these datasets, click on a grid point to view a popup containing a summary of its forecast values for the selected date/time.
Forecasted Fire and Smoke Indices
Several other parameters specific to fire and smoke risk are included in the Gridded Dataset menu. These are calculated by the State Climate Office of North Carolina using the National Blend of Models product. These datasets include the following parameters:
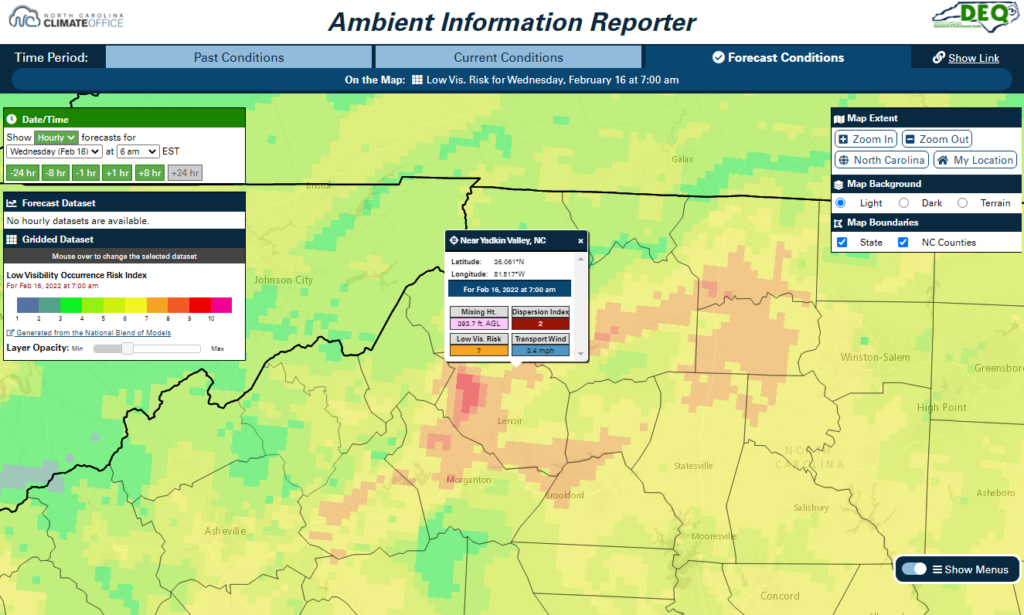
- The mixing height is the depth of the mixed layer of the lower atmosphere through which pollutants including smoke will be dispersed. During the daytime, the mixed layer tends to be deeper as warm air rises from the surface – a process called turbulent mixing. At night, as surface temperatures cool, the mixed layer is shallower and often only a few hundred feet, which traps pollutants near the ground. Backyard burning is often discouraged when the mixing height is less than 1,500 to 2,000 feet.
- The dispersion index accounts for both the mixing height and atmospheric stability to indicate how well smoke will disperse. Generally, daytime dispersion index values above 60 are preferred for burning, although values above 100 may indicate unpredictable conditions with potential fire control issues. Poor or very poor dispersion especially at night will likely cause pollutant-rich air to stagnate near the ground.
- The low visibility risk indicator is based on the dispersion index and surface-level relative humidity. This can help estimate the density of smoke or fog at the ground, with its categories ranging from 1 (best visibility) to 10 (worst visibility) determined using historical automobile accident data.
- The transport wind is the average wind speed between the surface and the mixing height above a given point. With transport wind speeds below to 10 miles per hour, smoke and pollutants are more likely to remain over a given area without much horizontal dispersion.
These fire and smoke indices are updated twice per day, usually just before 7 am and 1 pm Eastern time.
Example: Learn Before You Burn
You’re hoping to burn some leaves in your backyard tomorrow afternoon but want to make sure that any lingering smoke won’t affect local air quality. To check this, you look at the Forecast Conditions tab in the AIR tool.
First, you want to see what overall air quality is expected to look like on the day of your burn. Changing the date to tomorrow, you note the maximum AQI in the northern Mountains is forecasted to be in the Code Yellow range, which the EPA notes can pose some risk for people sensitive to air pollution.
Next, after selecting the hourly option from the Date/Time menu, you change the time to early the following morning and load the low visibility risk dataset. It shows some areas in your part of the Foothills with elevated risk values. Clicking near your location, you also notice a very low mixing height of less than 400 feet, a light transport wind, and poor dispersion.
Between the already-higher air quality on the day of your burn and the unfavorable conditions the night afterwards, this convinces you to save your burning until another day when the overall air quality is better and the risk of smoke being trapped near the ground overnight is much lower.