AIR Tool | Gridded Datasets
The AIR tool includes several gridded datasets that cover the entire state of North Carolina, including the gaps between our point-based air quality monitors and weather stations. These datasets can be a useful way to view local differences in variables such as precipitation, which can change dramatically even over short distances.
Radar and Satellite Imagery
In the “Gridded Dataset” menu on the Past and Current Conditions tabs, hourly radar and satellite imagery is available. The radar data can help identify where precipitation is falling, while satellite imagery can show features such as cloud cover, fog, and even some smoke plumes.
Gridded Precipitation Data
Using radar-estimated precipitation totals calibrated using ground-based rain gauges, the National Weather Service calculates daily gridded precipitation totals, which are available in the AIR tool for time periods ranging from the past day to the past 90 days. A percent of normal precipitation dataset is also available, which can help put recent rainfall totals into a climatological context.
Both the precipitation totals and percent of normal precipitation can be viewed on the Current Conditions tab or on the Past Conditions tab when daily data is selected in the Date/Time menu.
Example: A Wet Winter Month
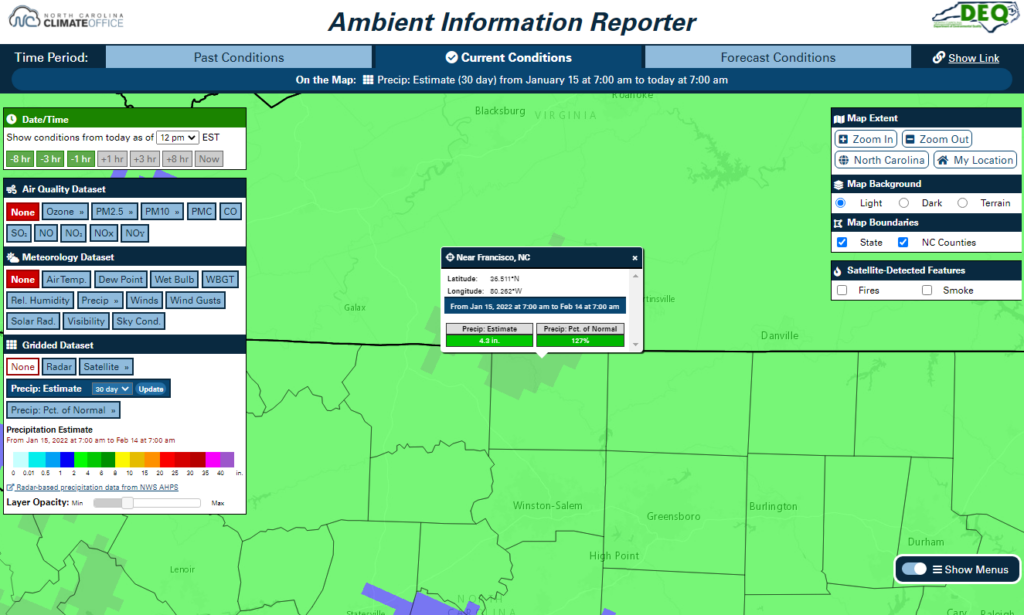
After several recent rain and snow events, you want to see how much precipitation has fallen in your area and how it compares to the typical conditions at this time of year.
In the Gridded Data menu on the Current Conditions tab, you display the Precip. Estimate dataset over the past 30 days. Clicking near your location in northern Stokes County, the popup indicates that an estimated 4.3 inches of total liquid precipitation has fallen in the past month, which is 27% above normal.