AIR Tool | Air Quality Datasets
The AIR tool provides access to high-quality and accurate air quality observations from monitors deployed across the state. Their sensors track the concentration levels of multiple pollutants that can cause health concerns including respiratory irritation.
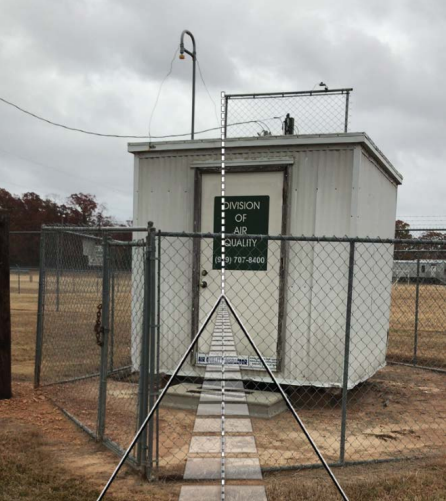
About Air Quality Monitors
The North Carolina Division of Air Quality (NCDAQ) has partnered with several agencies across the state to operate a network of air pollution monitors (partner agencies include Forsyth County Office of Environmental Assistance and Protection (Forsyth County) which serves Forsyth County, Mecklenburg County Air Quality (MCAQ) which serves Mecklenburg County, and Western North Carolina Regional Air Quality Agency (WNC) which serves Buncombe County).
These monitors are in a variety of locations and help determine population exposure, maximum concentrations, background concentrations, and regionally transported air pollution. Every year, the monitoring network is re-evaluated to ensure there is adequate coverage, with a complete network assessment performed every five years to anticipate future needs. The current North Carolina monitoring network consists of 75 monitors across 49 different monitoring sites. There are 38 sites operated by NCDAQ, five operated by MCAQ, three operated by Forsyth County, and three operated by WNC.
NCDAQ and its partner agencies have deployed monitors for several pollutants, including ozone and fine particle pollution (the two pollutants the DAQ prepares forecasts for). Additionally, there are air quality monitors for nitrogen oxides, sulfur dioxide, and carbon monoxide across the state, and as of 2021 there are two sites that have a Photochemical Assessment Monitoring Station (PAMS) that measure levels of ozone precursors.
There are a few different types of monitors, depending on what pollutant is being analyzed. Pollutants such as oxides of nitrogen, sulfur dioxide, carbon monoxide, and ozone are all gaseous pollutants, whereas fine particle pollution is made up of small particulates.
Monitors that report gaseous pollutants often use an infrared sensor to determine the concentration in a given sample. They consist of two chambers – one which has a known concentration of gas, and another with a sample of ambient air (i.e. a sample of the actual air outside). Since the infrared light will be absorbed differently depending on how much gas is present in the air sample, the sensor can see the difference between the two chambers and determine the concentration of the pollutant in question.
Monitors that measure concentrations of fine particle pollution often utilize a technique called beta attenuation monitoring, or BAM for short. Ambient air is drawn through a ribbon of filter material, where the fine particulates collect. A small amount of high-energy electrons (beta particles) is emitted before the air passes through the filter ribbon, and there are sensors that measure these particles both before and after passing through the filter ribbon. Fine particle pollution collected on the filter will reduce (or “attenuate”) the amount of beta particles that can pass through to be measured on the other side, and therefore the mass of the particulates can be determined (the second image depicts this process).
Once a monitor collects data, it is sent to the NCDAQ and its partner agencies. The data received is quality controlled for accuracy and validated before being certified and sent over to the EPA. The data received is made publicly available through the Ambient Information Reporter (AIR) Tool.
As of September 2024, the AIR tool also displays air quality monitor data from other states in the eastern US. Since North Carolina is often impacted by polluted air masses that arrive from other locations, such as during the Canadian wildfires in the summer of 2023, having access to this information from across our region of the country can make it easier to identify potentially problematic air quality conditions that could be headed in our direction.
Types of Pollutants
Pollutants generally fall into two categories: fine particulate matter and gaseous pollutants. These are described below, along with their potential human health impacts.
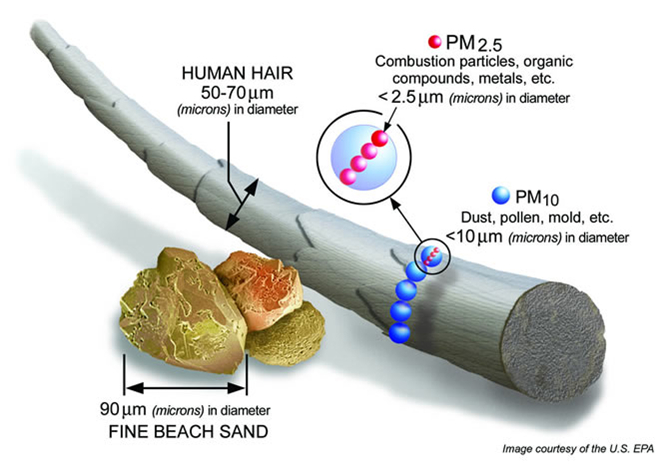
Fine Particle Pollutants (PM):
PM2.5 and PM10 – Fine particulate matter (PM) is a mixture of solid and liquid particles that are suspended in the air. Some particles can be seen with the naked eye (soot, ash, dust), while other particles are only visible using a microscope. For the purpose of the National Ambient Air Quality Standards (NAAQS), there are two size categories – PM10 and PM2.5. PM10 refers to particles that are ≤ 10 µm (micrometers) in diameter , whereas PM2.5 refers to particles ≤ 2.5 µm in diameter. For reference, the width of a human hair is 50 to 70 µm!
These particles can be inhaled and at high concentrations can cause adverse health effects, particularly in the lungs. Some particles are so small that they can even enter the bloodstream. Particle Pollution can also cause reduced visibilities at high concentrations and can make the sky appear hazy.
Sources of fine particle pollution include local and long-range transport of smoke from wildfires, blowing dust and dirt, and soot and ash from volcanoes. The smallest particles are often the byproduct of complex chemical reactions in the atmosphere between both natural and anthropogenic sources of pollution.
Gaseous Pollutants:
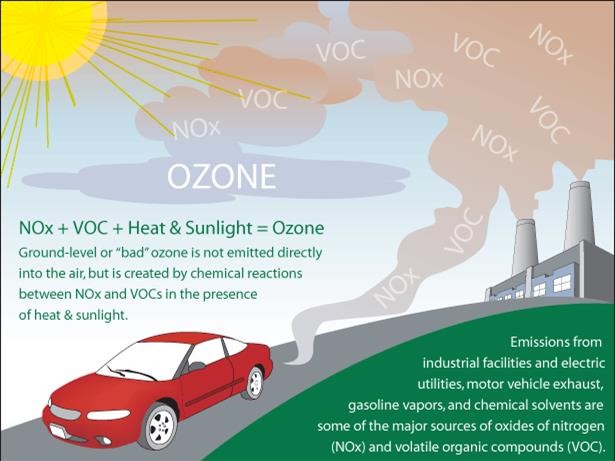
Ground-level Ozone – While many have heard of the ozone layer high up in the atmosphere that helps to shield the planet from solar radiation, ground-level ozone can cause adverse health effects at high concentrations. Tropospheric ozone, or ground-level ozone, is considered a “secondary pollutant.” This means that ozone is not emitted directly from cars or industry, but forms when there are precursor emissions (such as oxides of nitrogen (NOx) and volatile organic compounds (VOCs) that combine in the presence of sunlight. In addition, light winds limit the vertical mixing of air and help to encourage the formation of ozone. High ozone days most often occur during the summertime when a ridge of high pressure is over a region, resulting in light winds and plentiful sunshine.
Ozone can cause adverse health effects, particularly in sensitive populations (young children, older adults, people with asthma) and those who are active outdoors. Health effects experienced depend on the level of exposure, but can include coughing, a dry/scratchy throat, inflamed airways, and difficulty breathing.
Oxides of Nitrogen – Oxides of nitrogen (NOx) are highly reactive gasses. They can combine with VOCs in the presence of sunlight to form ground-level ozone, or react with other compounds to form fine particle pollution. These gasses are emitted by mobile sources like cars and trucks, and also industrial applications (including power generation).
Nitrogen Dioxide, or NO2, is an oxide of nitrogen that is regulated by the NAAQS. NO2 is an irritant to the human respiratory system, and short-term exposure can lead to respiratory symptoms. Prolonged exposure can lead to the development of asthma, and make one susceptible to respiratory infections. NO2 and NOx can also contribute to the formation of acid rain and can cause nutrient pollution in marine environments. Additionally, when NOx and NO2 combine with other compounds, nitrate particulates can form which contribute to fine particle pollution levels, resulting in adverse health effects and creating haze, which can reduce visibility. Particle pollution formed through chemical reactions is considered “secondary PM2.5” or “secondary PM10,” depending on the size of the particles.
Sulfur Dioxide – Sulfur Dioxide, or SO2, is a gaseous pollutant that can be detrimental to both human health and the environment. The largest source of SO2 is fossil fuel combustion by power plants and vehicles and other heavy equipment that burn high-sulfur fuel. It can also be emitted through other industrial processes (such as extracting metal from ore), or be released naturally via volcanoes.
Short-term exposure to SO2 can result in adverse affects to the human respiratory system. Gaseous SOx can adversely affect the environment as well, damaging trees and foliage and contributing to acid rain that can harm sensitive ecosystems. At high concentrations of SO2, other sulfur oxides (SOx) can form which can then react with other compounds to form sulfate particulates. These particulates contribute to fine particle pollution levels, resulting in adverse health effects and creating haze, which can reduce visibility. Particle pollution formed through chemical reactions is considered “secondary PM2.5” or “secondary PM10,” depending on the size of the particles.
Carbon Monoxide – Carbon Monoxide (or CO) is a colorless, odorless gas that is a product of incomplete combustion of carbon-containing compounds. Sources of CO include vehicles and other machinery that burn fossil fuels. High concentrations of CO are more often found indoors, resulting from unvented space heaters, leaking chimneys and furnaces, and gas stoves.
When there are high levels of CO (either indoor or outdoor), it inhibits the ability of the blood stream to transport oxygen to critical organs. Very high levels of CO can cause dizziness, confusion, unconsciousness, and death. Due to CO causing adverse cardiovascular health effects, people with heart disease are particularly vulnerable to elevated levels of CO, especially during exertion or when experiencing other types of increased stress.
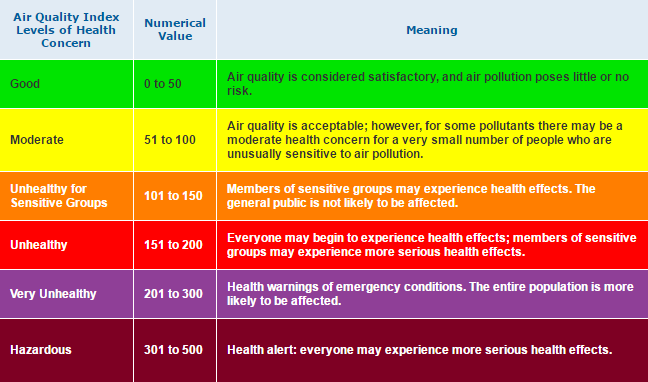
Daily Measurements and AQI
On the Past Conditions tab, daily-aggregated parameters are enabled by default. These include the Air Quality Index, which is the Environmental Protection Agency’s primary indicator for assessing pollution levels and describing their potential impacts.
The AQI can be calculated for a number of pollutants, including ozone, PM2.5, PM10, CO, NO₂, and SO2. Each uses a different standard, from the maximum one-hour concentration during a 24-hour period to the maximum 8-hour average to the average concentration across all 24 hours. Each pollutant is selectable in the dropdown menu within the AQI dataset button.
Pollutant concentration information is also accessible within the Air Quality Dataset menu. For parameters with which AQI can be calculated, their values on the map are color-coded using the AQI color scale.
Hourly Measurements
Air quality concentrations can be displayed at an hourly timescale on the Past and Current Conditions tab. In fact, the Current Conditions tab shows the latest PM2.5 concentration by default. This can be changed in the Air Quality Dataset menu.
Note that for several pollutants, the AQI color scale is used for hourly concentrations. This can help illustrate the relative severity of air quality conditions. However, the daily Air Quality Index may not always reach those levels — or it may reach higher values, depending on conditions throughout the rest of the day. Recall that AQI standards for some parameters use an 8-hour or a 24-hour average. In these cases, a single hourly value may not be indicative of overall daily conditions. Because of that, the color-coding for hourly concentrations should be considered a reference only.
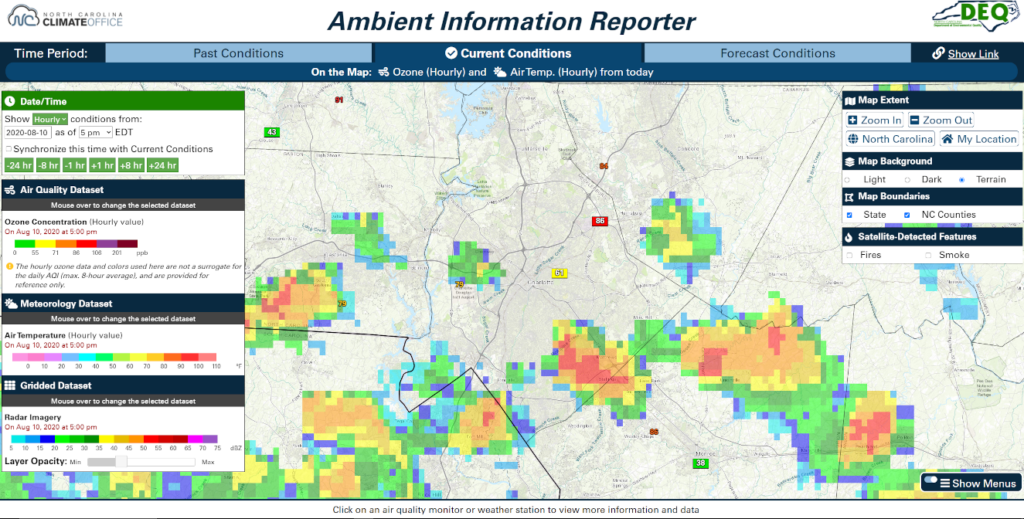
Example: High Ozone Between Storms
It’s a steamy summer afternoon in the Queen City of Charlotte, NC. The forecast calls for scattered showers and storms to develop soon, and you’re thinking about getting in your daily run before the storms hit. You can check the AIR tool to make sure that hourly pollutant concentrations are healthy before heading out.
On the Current Conditions tab, make sure that hourly Ozone is selected; the dropdown menu within the Ozone button allows you to view hourly or the current maximum 8-hour average. You can also select the current Air Temp. in the Meteorology Dataset section, and if you want to see where those storms are, load up the Radar in the Gridded Dataset menu.
Despite seeing some clouds and storms not too far away when you look outside, the AIR tool reveals unhealthy levels of ozone are present in Mecklenburg County, with thunderstorms nearby. With this information, you don’t risk exerting yourself and breathing in elevated levels of ozone and decide to exercise indoors instead.
Data Source and Details
The observations made by monitors across North Carolina feed into AirNow, a national database of air quality data, which disseminates it for use in resources including the AIR tool. Because of the quick turnaround to ensure data availability in near-real-time, data in the AIR tool is considered preliminary as of the time at which each observation was made. While this data does undergo a basic quality check by AirNow, observations initially flagged as bad occasionally turn out to be valid (such as if pollutant concentrations spike due to a legitimate phenomenon like a smoke plume), or vice versa. Due to the raw nature of this data, it should not be used for scientific or medical research purposes. For these cases, validated historical air quality observations are available from the EPA’s Air Quality System (AQS).