AIR Tool | Meteorology Datasets
Next to sticking a hand out the window, weather stations are our best way of knowing what’s happening outside, and because they use automated instrumentation, they can monitor conditions day and night.
Even on days when the air quality is favorable, the weather may sometimes make outdoor activities difficult or even dangerous. For example, sizzling summer afternoons can cause heat stress for humans and animals. A passing thunderstorm may put a disappointing damper – or a surprising shock – on your picnic. And windy weather may cause both your kite and your backyard burn to unexpectedly drift out of control.
Meteorology data in the AIR tool can help track these hazards and other weather conditions in your area.
About Weather Stations and Networks
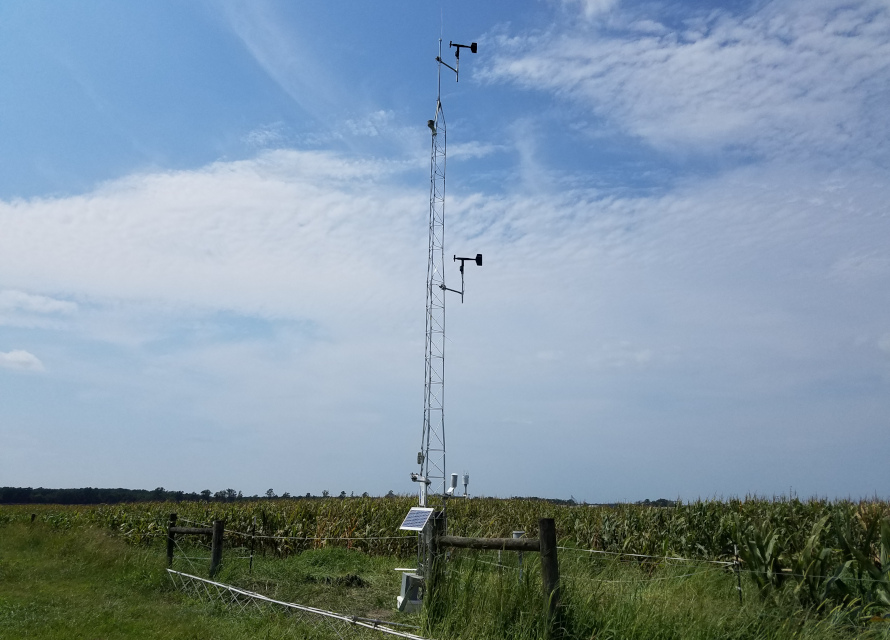
To meet World Meteorological Organization standards, most weather stations measure conditions at multiple levels – including temperatures at a 2-meter height and winds at a 10-meter height – and are generally located in areas with good exposure, ideally sited far from nearby obstructions such as trees and buildings.
Other instrumentation and station characteristics vary depending on the station’s network and its purpose. Three different networks are available in the AIR tool:
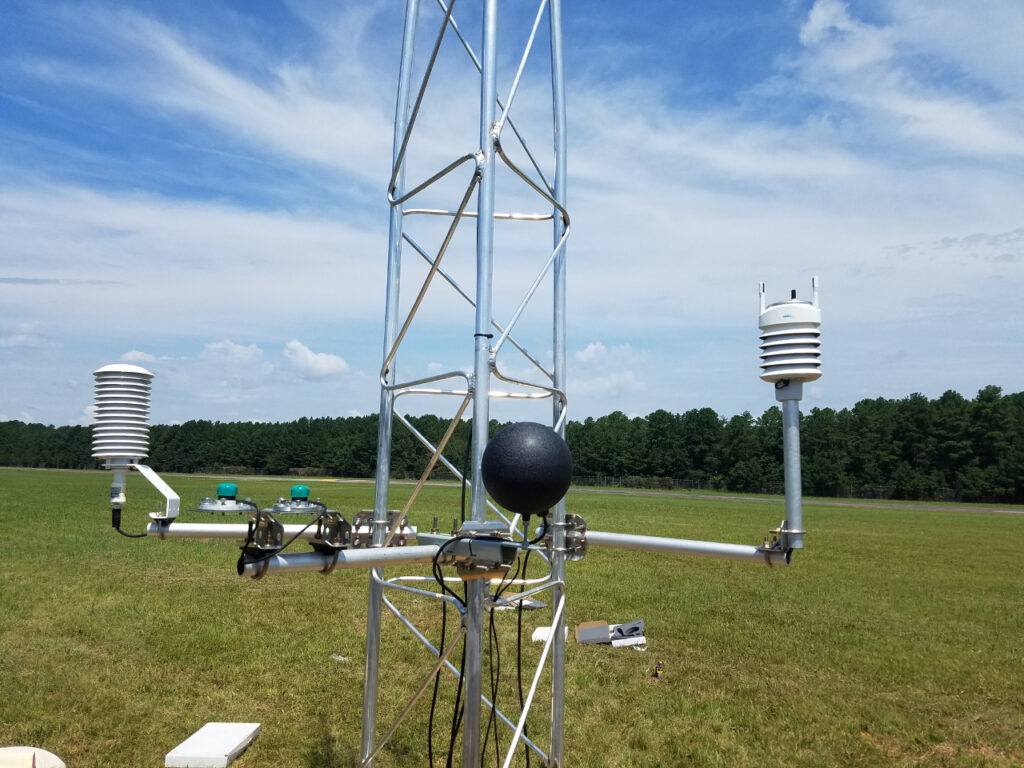
- The ECONet is operated and maintained by the State Climate Office of North Carolina. These stations include research-grade sensors including unique instruments such as pyranometers, which measure solar radiation, and black globe thermometers, which measure Wet Bulb Globe Temperature, a good indicator of human heat stress. ECONet stations measure data every minute, although only top-of-the-hour observations are shown in the AIR tool to be consistent with other networks.
- ASOS, or the Automated Surface Observing System, is operated jointly by the National Weather Service, the Federal Aviation Administration, and the Department of Defense. These stations are located at major airports and military bases with the primary goal of informing incoming and outgoing air traffic about atmospheric conditions. As such, these stations include instruments such as ceilometers, which can measure the height of clouds above the ground. Some ASOS stations use human observers to report hourly weather conditions, such as the precipitation type and the presence of nearby hazards like thunderstorms and lightning.
- AWOS, or the Automated Weather Observing System, is similar to ASOS, but these stations are mainly located at smaller airports. Instead of making a single observation near the top of the hour, AWOS stations may report data up to three times per hour, or every 20 minutes. Precipitation is reported as the amount falling since the previous observation or since the beginning of the hour. This means for a station that makes its final observation at :45 after the hour, any precipitation from :45 to :00 is never reported, and the :05 report includes only five minutes’ worth of precipitation data. Because of this tendency to underreport rainfall amounts, use AWOS precipitation totals with caution.
Since some instrumentation varies by network, be aware that not all weather parameters will be available at every station. For instance, only ECONet stations measure solar radiation, while only ASOS and AWOS stations measure visibility and sky conditions.
As of September 2024, ASOS observations from across much of the eastern US are available in the AIR tool. Together with the air quality monitoring data from this region, these weather observations such as the reported wind and visibility conditions can help determine whether polluted air masses could be moving toward North Carolina.
Available Parameters
On the Past and Current Conditions tabs in the AIR tool, the following weather variables can be selected under the Meteorology Dataset menu:
- Air temperature is the observed ambient temperature at a height of 2 meters above the ground. Temperature sensors are located in a gill shield, which shields them from direct sunlight but allows air circulation around the sensor.
- Dew point is the air temperature at which condensation begins, which can cause the formation of clouds and precipitation. Comparing the air temperature and dew point can offer a good indication of the moisture content in the atmosphere. For instance, a small difference between the two means the air is already nearly saturated, and falling precipitation is less likely to evaporate near the ground.
- The wet bulb temperature is another measure of the atmospheric moisture content. While dew point represents the temperature change only due to increasing water vapor, the wet bulb also incorporates the evaporative cooling effect that occurs as air becomes saturated. Because of this, the wet bulb is usually between the dew point and the observed air temperature.
- The Wet Bulb Globe Temperature, or WBGT, is a more accurate measure of human heat stress than traditional measures such as the heat index. WBGT accounts for the temperature in direct sunlight and the human body’s response to ambient conditions including heat, humidity, and winds. WBGT values fall into several color-coded ranges that have been adopted by groups such as high school athletic associations to inform precautionary actions needed for outdoor activities. The AIR tool uses the same WBGT methodology as the National Weather Service.
- Relative humidity is the final and most familiar measure of atmospheric moisture available in the AIR tool. Expressed as a percentage between 0 and 100, the relative humidity is an indicator of water vapor content with respect to the current air temperature.
- Precipitation totals are available in the AIR tool for the selected hour or date. Precipitation is measured in hundredths of an inch, and is always converted to a liquid total even during frozen events.
- Winds in the AIR tool are represented by an arrow showing the direction and speed of the winds measured at a height of 10 meters above the ground. These sustained winds are averaged over a two-minute period.
- Wind gusts show only the speed of the highest 5-second average wind measured at each station.
- Solar radiation is a measure of the amount of incoming sunlight reaching the earth’s surface. The maximum solar radiation varies by time of day, time of the year, and latitude, since different areas receive different amounts and intensities of daylight throughout the year.
- The visibility measured by ASOS and AWOS stations can be viewed in the AIR tool. The maximum visibility is 10 statute miles, and visibility tends to be lower when obstructions such as low clouds, fog, or precipitation are present.
- Sky conditions are based on a combination of the cloud cover, present weather, and precipitation type reported by ASOS and AWOS stations. On the map, this parameter is represented by icons, ranging from sunny skies to partial cloud cover to various types and intensities of precipitation.
Hourly Measurements
Hourly weather data on both the Past and Current Conditions tabs always uses the top-of-the-hour observation from each weather station. At ECONet stations, this is based on data measured at or just before the beginning of the hour. At ASOS and AWOS stations, their hourly observation is typically made from 5 to 20 minutes before the top of the hour.
Some parameters such as solar radiation use instantaneous measurements, while others may use average values over the span of a few seconds (as with wind gusts) or minutes. Precipitation always represents a total accumulation, either over the previous hour or for the entire day, depending on the selected option.
Daily Measurements
On the Past Conditions tab, daily parameter options are enabled by default. (These can be changed to hourly options using the dropdown in the Date/Time menu.)
Daily weather data options include 24-hour maximum and minimum values for temperature-based parameters, humidity, and visibility; 24-hour maximum values for WBGT, winds, wind gusts, and solar radiation; and 24-hour total precipitation.
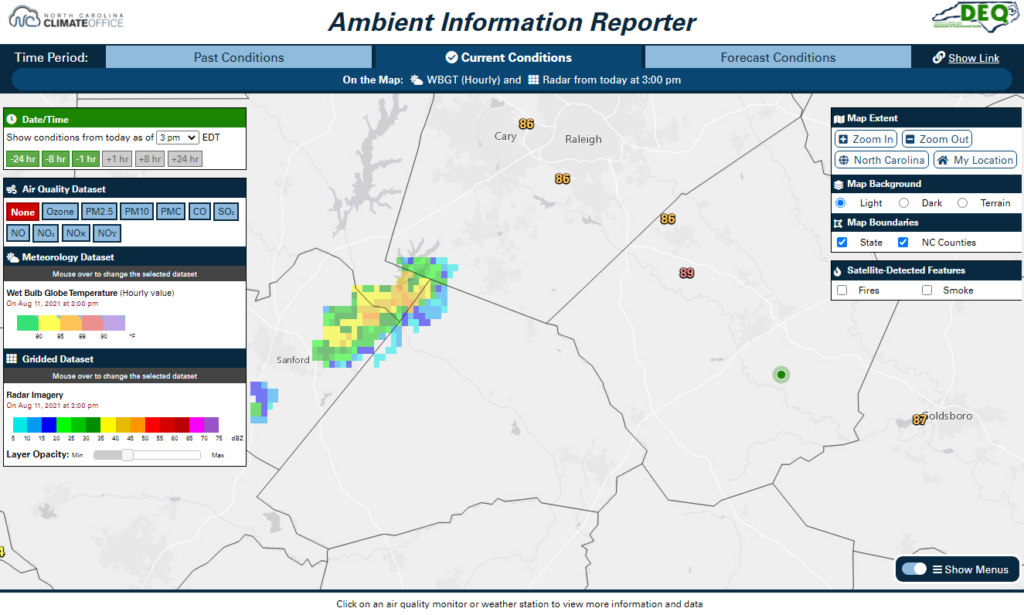
Example: Dog Day Danger
Amid a sizzling summer week, you check the AIR tool before heading outside for an afternoon walk. First, you see that air temperatures have already reached the low-90s in your area.
Checking the Wet Bulb Globe Temperature (WBGT) as a measure of heat stress, it’s in the orange to red range. You also load gridded radar imagery and notice a shower has popped up to your west.
Knowing that a WBGT of 89°F can cause heat stress after 20 minutes of exercise, and seeing a shower in the vicinity, you decide to keep your walk short to avoid being caught in the heat – and the rain.