Recent Posts

Beyond a Number: Making and Verifying an Air Quality Forecast
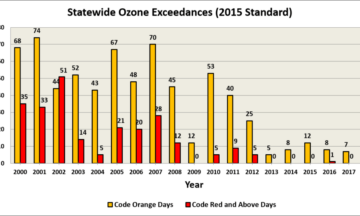
This post originally appeared on the State Climate Office’s Climate Blog in October 2018 as a guest post written by NC DAQ forecasters. Previously, we discussed the significant improvements...