This post originally appeared on the State Climate Office’s Climate Blog in August 2014 as a guest post written by NC DAQ forecasters.
For many locations in the Tar Heel State, June 29, 2012, was as hot as any day has ever been. The RDU Airport tied its all-time daily maximum temperature record of 105°F, and much of the state was well over the century mark.
Later that evening, a historically destructive and widespread derecho — a long-duration, damaging wind storm that is fueled in part by extremely hot air — rolled through the state, resulting in numerous wind damage reports. Finally, the Charlotte and Triangle regions suffered their poorest air quality since August 2007 as ozone levels spiked in the Code Red AQI range at monitors in both regions.
Meteorology Behind Poor Air Quality
Poor air quality episodes in North Carolina often share a common feature: a stagnant air mass. Stagnant air masses occur when surface winds become light, which allows slow-moving air molecules to collect increased amounts of pollutants as they move across an area.
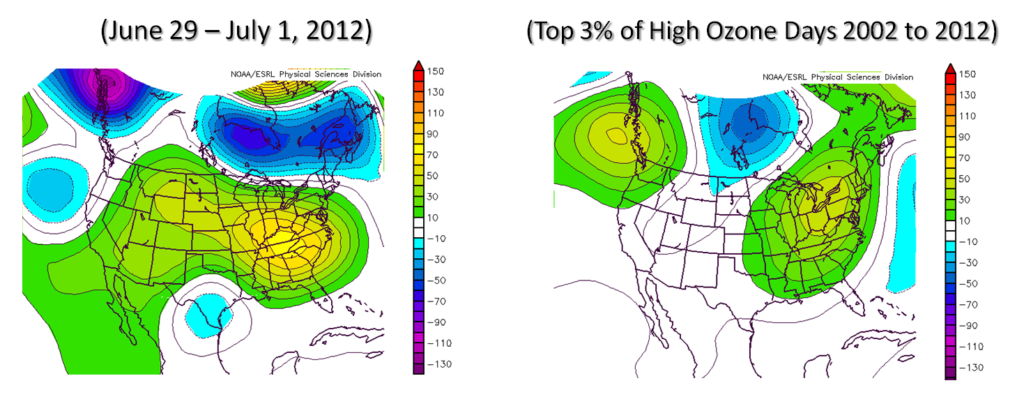
When an air mass stagnates, it is typically the result of an upper-level ridge, or a large area of high pressure aloft, which results in mostly sunny skies, hot and dry air, and light winds at the surface. Recall from our previous post that these are also the favorable “ingredients” for ozone formation.
On June 29, 2012, an unusually strong ridge of high pressure aloft developed in the Central Plains during the week of June 24th and progressed eastward to the Tennessee Valley by June 29th. This allowed a very stagnant and polluted air mass, which was essentially trapped under the intense upper-level ridge, to develop and progress eastward towards the eastern US.
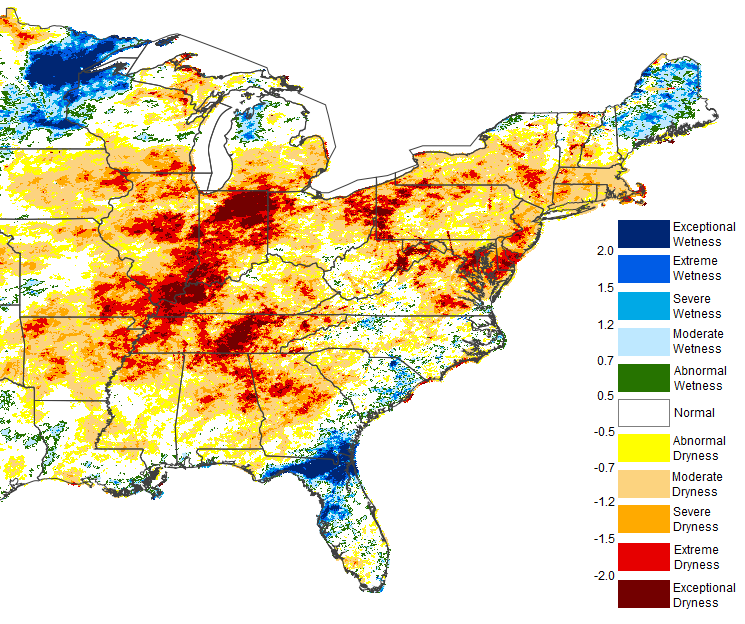
The anomalously strong ridge may have been exacerbated by another factor: drought. When drought conditions persist over a region for many months, dry weather patterns often persist because of cyclical processes: In drought-stricken areas, upper-level ridges are prominent and result in sinking, hot, and dry air that ultimately leads to reduced precipitation. As the surface soil moisture diminishes, this limits moisture being evaporated back into the atmosphere to form clouds and ultimately precipitation, which then reinforces the ridge and continues the cycle until something is able to break it down.
An ongoing, long-term drought over the central US, including across the Tennessee Valley and much of North Carolina, likely had a role in allowing the extremely hot, dry air mass that developed under the ridge in the Plains to progress eastward while maintaining its intensity.
High Ozone in NC
As NC DAQ forecasters analyzed all of the aforementioned variables and as computer models continued to suggest that the massive complex — the ridge aloft, along with the hot, polluted air mass at the surface — would build eastward toward the southeastern US, it became obvious that a significant high ozone event would affect North Carolina.
And what a significant event it was:
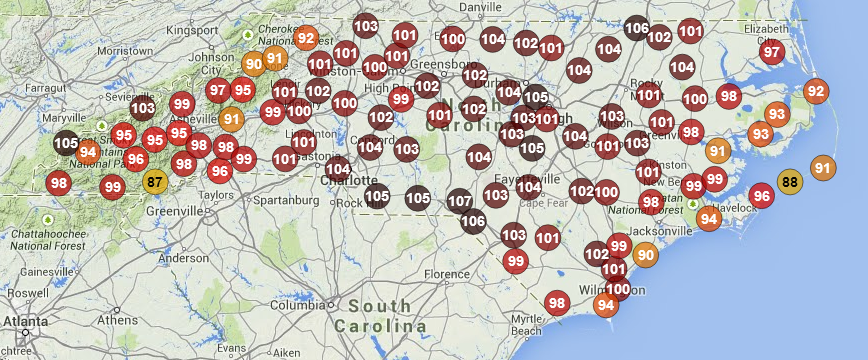
- 38 out of 40 ozone monitors across the state exceeded the EPA-established ozone standard of 75 parts per billion (Code Orange AQI).
- 5 monitors reached Code Red (>85 ppb) AQI levels
- A 1-hour ozone peak of 103 ppb was observed at Mount Mitchell
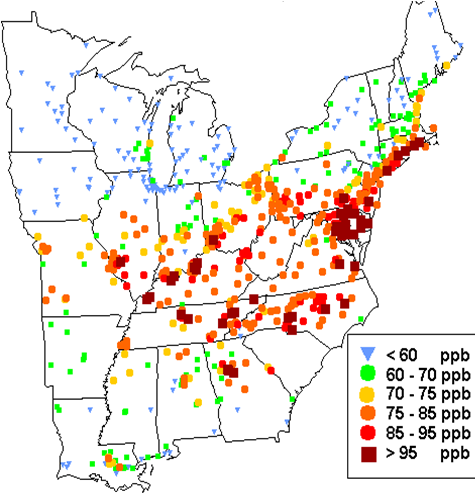
One reason the 2012 event was so severe was because ozone was transported into the state from the west, where pollution had been accruing for days under the hot upper-level ridge. Even at monitors located along the Asheville ridge tops, where there is very little influence from local cars or factories, ozone levels of 88 ppb were measured. That was a clear indication that ozone was moving into the state from the west.
The June 29, 2012, ozone event was a textbook case of meteorology impacting air quality. We like to say that forecasting the weather is like solving a puzzle, and if that’s true then forecasting air quality is like solving an even bigger one. We hope you’ve enjoyed our look at air quality forecasting and don’t forget to know the code (the AQI code, that is)!