Earlier this month we discussed the National Ambient Air Quality Standards (NAAQS), but how do we measure air quality to ensure our air is within the confines of these limits? The North Carolina Division of Air Quality (NCDAQ) has partnered with several agencies across the state to operate a network of air pollution monitors (partner agencies include Forsyth County Office of Environmental Assistance and Protection (Forsyth County) which serves Forsyth County, Mecklenburg County Air Quality (MCAQ) which serves Mecklenburg County, and Western North Carolina Regional Air Quality Agency (WNC) which serves Buncombe County). These monitors are in a variety of locations and help determine population exposure, maximum concentrations, background concentrations, and regionally transported air pollution.
Statewide Monitoring Network
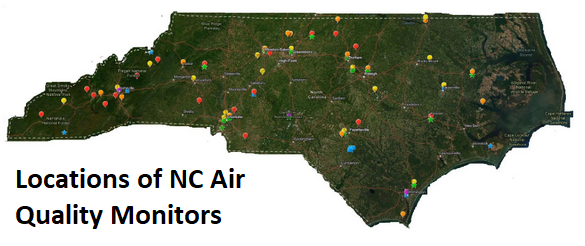
NCDAQ and its partner agencies have deployed monitors for several pollutants, including ozone and fine particle pollution (the two pollutants we prepare forecasts for). Additionally, there are air quality monitors for nitrogen oxides, sulfur dioxide, and carbon monoxide across the state, and as of 2021 there are two sites that have a Photochemical Assessment Monitoring Station (PAMS) that measure levels of ozone precursors. Every year, the monitoring network is re-evaluated to ensure there is adequate coverage, with a complete network assessment performed every five years to anticipate future needs. The current North Carolina monitoring network consists of 75 monitors across 49 different monitoring sites (see the map below). There are 38 sites operated by NCDAQ, five operated by MCAQ, three operated by Forsyth County, and three operated by WNC.
A Look Inside an Air Quality Sensor
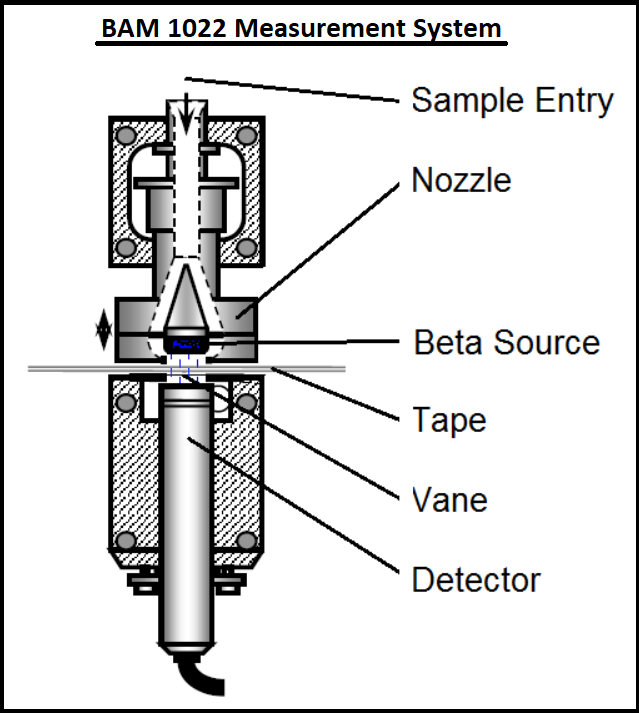
So how do these monitors work, exactly? First, it depends on what pollutant is being analyzed. Pollutants such as oxides of nitrogen, sulfur dioxide, carbon monoxide, and ozone are all gaseous pollutants, whereas fine particle pollution is made up of small particulates. Monitors that report gaseous pollutants often use an infrared sensor to determine the concentration in a given sample. They consist of two chambers – one which has a known concentration of gas, and another with a sample of ambient air (i.e. a sample of the actual air outside). Since the infrared light will be absorbed differently depending on how much gas is present in the air sample, the sensor can see the difference between the two chambers and determine the concentration of the pollutant in question. Monitors that measure concentrations of fine particle pollution often utilize a technique called “beta attenuation monitoring” (or BAM for short). Ambient air is drawn through a ribbon of filter material, where the fine particulates collect. A small amount of high-energy electrons (beta particles) is emitted before the air passes through the filter ribbon, and there are sensors that measure these particles both before and after passing through the filter ribbon. Fine particle pollution collected on the filter will reduce (or “attenuate”) the amount of beta particles that can pass through to be measured on the other side, and therefore the mass of the particulates can be determined (the second image depicts this process).
Once a monitor collects data, it is sent to the NCDAQ and its partner agencies. The data received is quality controlled for accuracy and validated before being certified and sent over to the EPA. The data received is also made publicly available. We recently shared a link to our new Ambient Information Reporter (AIR) Tool which is home to our monitoring data, but stay tuned for our next post where we take a dive on how to find additional data, and how to interpret it!