
Folks just west of the Raleigh-Durham International Airport on Monday night may have seen or smelled smoke lingering into the early morning hours on Tuesday. It appears likely that a combination of celebratory fireworks and an overnight temperature inversion led to the smoky conditions observed in that area. Let’s examine why this happened.
A Quick Refresher on Inversions
If you’re not familiar, temperature inversions occur when the profile of the ambient air temperature increases with height instead of decreasing. This phenomenon acts like a cap on the lower atmosphere and tends to trap pollution in that inverted layer.
A temperature inversion’s impact on air quality is a topic we’ve discussed in several past blog posts, but those examples have focused on their prevalence in the winter season. Inversions happen throughout the year, but we tend not to notice them as much in the warmer months because they’re typically weaker and less pronounced.
However, if we get a decent inversion on a day when fine particulate (PM2.5) emissions are high, they can have a noticeable impact. This happens most commonly when fireworks are involved during Fourth of July celebrations. Diwali is another festival often celebrated with fireworks, which runs from October 18-22 this year. Many community-led celebrations occurred on the evening of October 20 and smoke from those large gatherings and from individual celebrations likely contributed to the high PM2.5 readings that were observed.
Atmospheric Setup
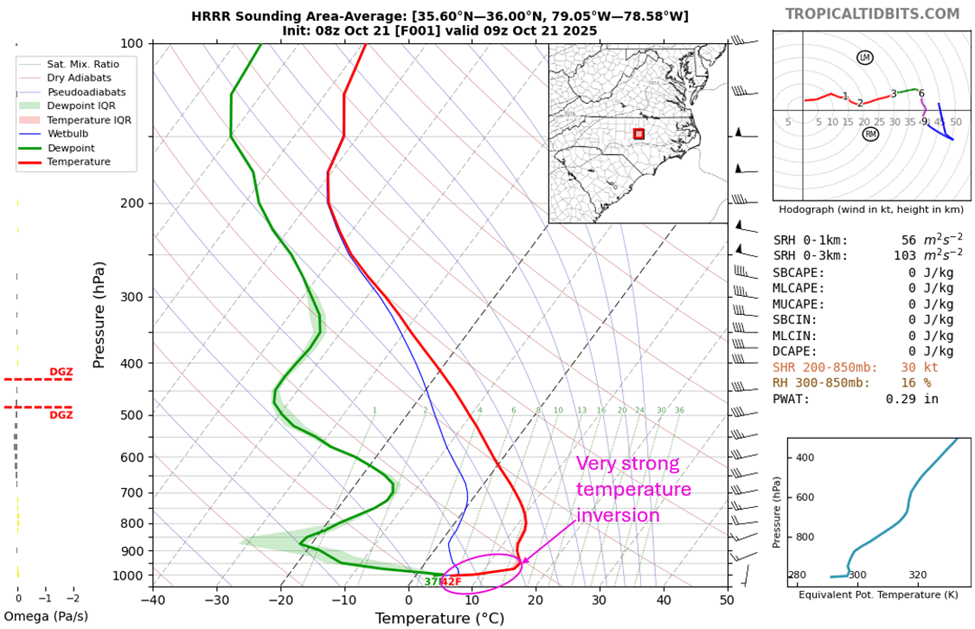
A broad ridge of high pressure aloft and weak high pressure at the surface resulted in subsidence (sinking air), calm to light winds, and strong radiational cooling over the southeastern US on Monday night. The resulting inversion persisted into the late morning on Tuesday until the sun warmed the lower portion of the boundary layer and the inversion dissipated. You can see evidence of Monday night’s inversion in the forecasted skew-t diagram below, highlighted within the purple circle.
Observed PM2.5 Concentrations
Elevated PM2.5 concentrations were measured by the Burdens Creek monitor in southern Durham County, an experimental test site operated and maintained by the EPA’s Office of Air Quality Planning and Standards. Although this monitor is not part of NC Division of Air Quality’s official regulatory network, we do include it on our Ambient Information Reporter (AIR) tool to give us another set of observations. The Burdens Creek readings were corroborated by several nearby PurpleAir sensors, which we also recently added to the AIR tool to enhance the spatial coverage of PM2.5 data. Although, again, these low-cost sensors are not part of NC DAQ’s network, they help us to pinpoint localized events and provide a more complete air quality picture for forecasting purposes.
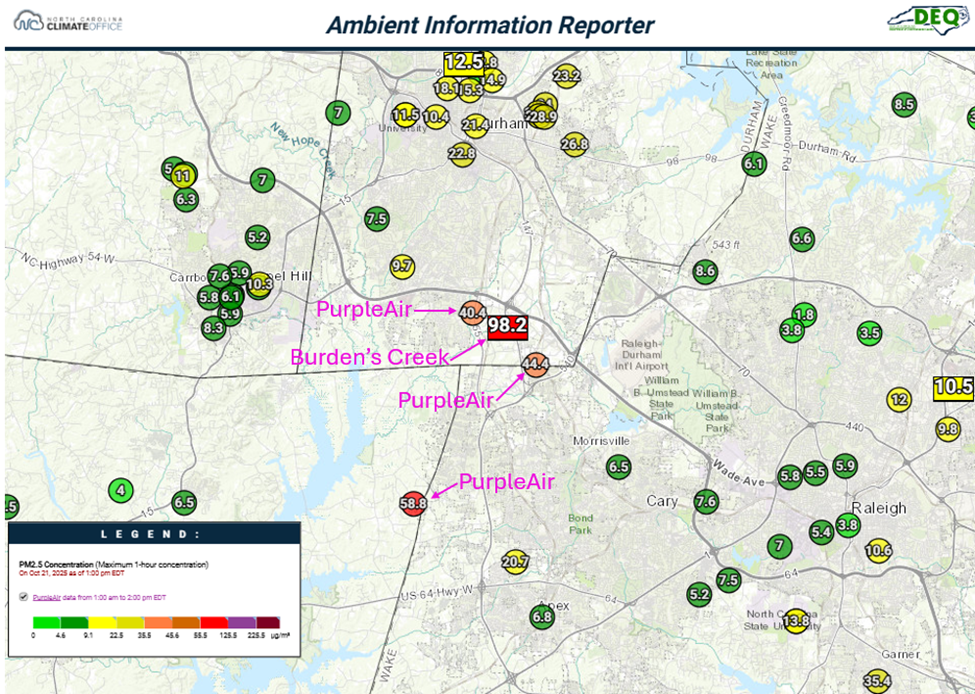
Notice how localized the higher readings are, surrounded by good to moderate air quality levels to the east and west. This episode highlights the reason why we value these additional non-regulatory monitors – if we didn’t have the data, we may have missed this event entirely. This knowledge helps us more accurately forecast during Diwali celebrations in future years, just like we pay special attention to air quality on the Fourth of July.
Daily Average Conundrum
This brings us to a common challenge for air quality forecasters regarding the 24-hour PM2.5 standard. By late morning on Tuesday, observed values at Burdens Creek had steadily dropped back into the Code Green range after the lower atmosphere warmed, mixing increased, and the inversion dissipated. EPA’s short-term health-based standard is based on 24 hours of exposure. Luckily, the peak of this episode occurred at a time when most people were inside sleeping. However, those early hours of elevated values heavily skewed the daily average, making it tricky for us to communicate relevant health messaging when pollutant concentrations varied so wildly within a 24-hour period.
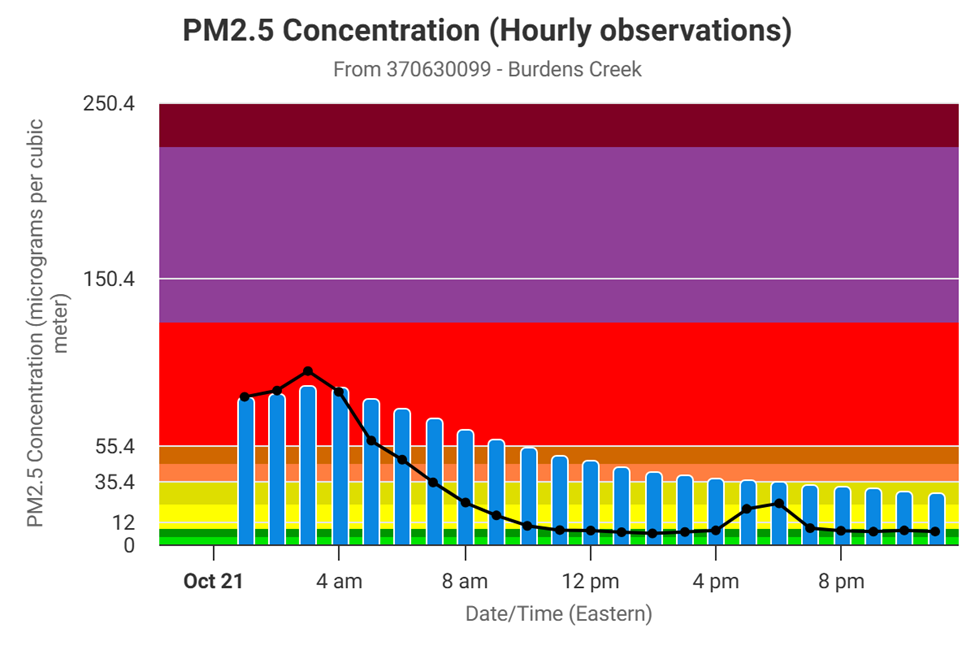
We forecast for the highest daily average expected at any location within each county, so our lead NC DAQ meteorologist adjusted the forecast on Tuesday morning to account for the early morning values, anticipating the daily average to net out in the upper Code Yellow range. All said, this was another interesting example of the challenge of incorporating a short-term air quality event into our daily forecast as well as a great example of the benefits of utilizing non-regulatory monitors for forecasting purposes.
You can find the latest forecast, discussion, and link to current conditions at the Air Quality Portal (deq.nc.gov/AQI).