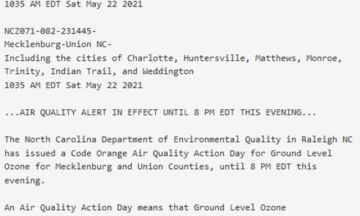
By Heather WylieOccasionally, meteorologists at the Division of Air Quality will send out an Air Quality Alert – What does that mean? In our typical day to... |Air Quality Blog
By Heather WylieThe Air Quality Index The Air Quality Index, or AQI, is a way to convey the state of air quality to the population. It is... |Air Quality Blog
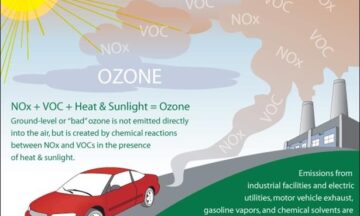
By Heather WylieTropospheric vs Stratospheric Ozone While many have heard of the ozone layer high up in the atmosphere that helps to shield the planet from solar... |Air Quality Blog
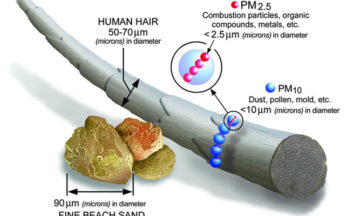
By Heather WylieWhat is PM2.5? Have you ever wondered what fine particle pollution is, or why we forecast a PM2.5 AQI? Fine particle pollution is made of... |Air Quality Blog
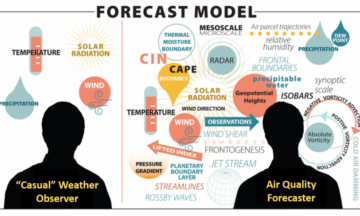
By Bradley McLamb, Elliot Tardif, Nick Witcraft and Rebecca WiegandThis post originally appeared on the State Climate Office’s Climate Blog in October 2018 as a guest post written by NC DAQ forecasters. Our final post in this year’s... |Air Quality Blog
By Bradley McLamb, Elliot Tardif and Nick WitcraftThis post originally appeared on the State Climate Office’s Climate Blog in October 2018 as a guest post written by NC DAQ forecasters. Previously, we discussed the significant improvements... |Air Quality Blog
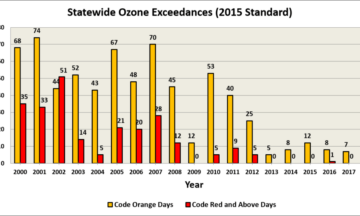
By Bradley McLamb, Elliot Tardif and Nick WitcraftThis post originally appeared on the State Climate Office’s Climate Blog in October 2018 as a guest post written by NC DAQ forecasters. North Carolina’s air quality has improved... |Air Quality Blog
By Bradley McLambThis post originally appeared on the State Climate Office’s Climate Blog in August 2014 as a guest post written by NC DAQ forecasters. For many locations in the Tar... |Air Quality Blog
By Bradley McLambThis post originally appeared on the State Climate Office’s Climate Blog in August 2014 as a guest post written by NC DAQ forecasters. Air pollution can...