The Air Quality Index
The Air Quality Index, or AQI, is a way to convey the state of air quality to the population. It is a color-coded scale to indicate how clean (or not) the air we breathe is, varying from Green (good air quality) to Maroon (hazardous air quality for all). The AQI focuses on health effects and is based off the National Ambient Air Quality Standards (NAAQS). It is a calculated value for five major air pollutants regulated by the Clean Air Act: Ozone, Particle Pollution, Carbon Monoxide, Sulfur Dioxide, and Nitrogen dioxide. Each pollutant has their own breakpoint threshold for each color category, each of which have a temporal (time) resolution of either 1, 8, and/or 24 hours.
Ozone and PM2.5 Forecasts
Here in North Carolina, we provide forecasts for ozone and fine particle pollution (PM2.5). The AQI for ozone is based on a rolling 8-hour average concentration, while particle pollution is based on a 24-average concentration. This is why you will sometimes see a daily AQI in the Code Green range when there were hourly concentrations in the Code Yellow or higher range. In our forecast discussion, we often address inter-hour volatility when it is appropriate, or whether or not elevated concentrations can be expected all day or just certain times of the day. For example, in our winter months we will often see what’s called a “surface temperature inversion” in the overnight hours as the surface cools but the air aloft remains relatively warm. This inhibits vertical mixing and can trap fine particle pollution at the surface. When this occurs, we will often see elevated overnight/early morning fine particulate levels in the mid to upper Code Yellow range that mix out as the day progresses and the inversion erodes. When this is expected, we will note in our forecast discussion to anticipate the highest values of the day in the early morning hours.
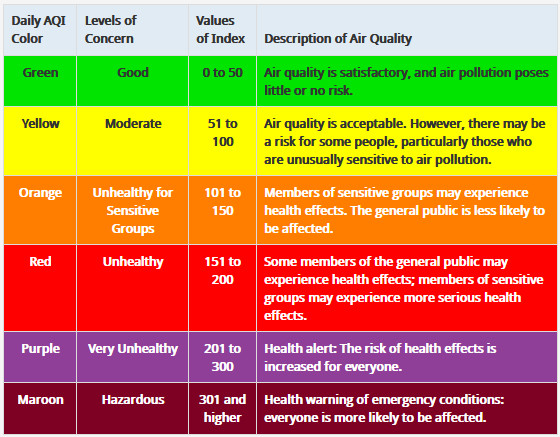
The AQI Color Scale
As mentioned above, the AQI is represented by a number associated with a color scale:
Typical Air Quality in NC
More often than not, citizens of North Carolina will mostly see daily AQIs in the Code Green to Code Yellow range. Code Orange days happen occasionally and typically occur during the ozone season in the larger metropolitan areas of the state, or where there is regional smoke/dust transport. AQI categories of red or higher are not very common here in the Tarheel State, but during wildfire events smoke can cause localized impacts at the upper end of the AQI scale.
Please check out the homepage of the Air Quality Portal for more details regarding what’s happening with North Carolina’s day-to-day air quality, including a written discussion with the details that inform our forecast.