In an earlier post, we discussed the Air Quality Index and how it measures the state of the air. We mentioned that the breakpoints for each color category is based on the National Ambient Air Quality Standards (NAAQS). Below, we will discuss what those standards are, and how they’ve evolved over time.
Basic NAAQS Facts
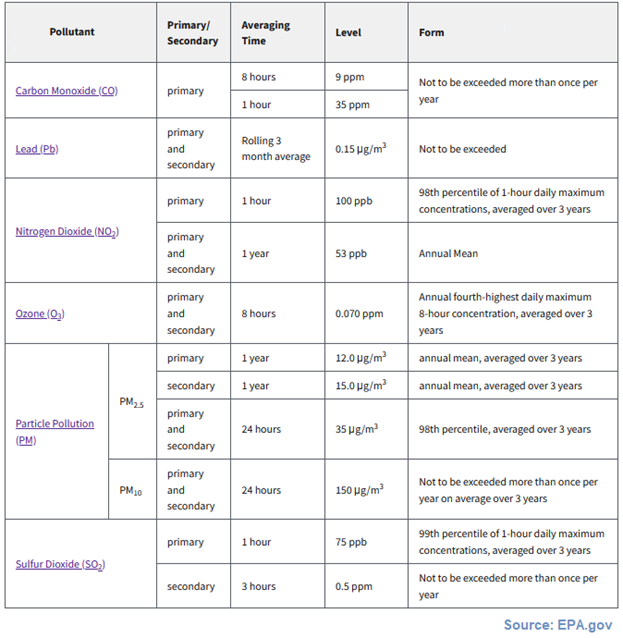
The Clean Air Act requires the EPA to set NAAQS for six criteria pollutants including fine particle pollution, ozone, carbon monoxide, lead, nitrogen dioxide, and sulfur dioxide. Two different sizes of fine particle pollution have NAAQS standards: PM2.5 includes particulate matter that is <2.5 micrometers in diameter, and PM10 includes particulate matter that is <10 micrometers in diameter. With the exception of carbon monoxide, each criteria pollutant has both primary and secondary standards. Primary standards are those that protect public health, while secondary standards protect public welfare (i.e. decreased visibility, damage to crops/infrastructure, etc). The image below shows a table of each NAAQS pollutant and its associated standard(s) with varying averaging times, cutoff points, and forms. It’s important to note that the cutoff for Code Orange air quality (Unhealthy for Sensitive Groups)–the threshold where an Air Quality Alert is activated–is the level of the NAAQS standard for each respective pollutant.
Standards are Updated Periodically
These standards are periodically reviewed and revised—the most recent revision of which was in 2015 when the ozone standard was lowered to 70 ppb from 75 ppb, which remained unchanged during the 2020 review. In 2012, the annual PM2.5 standard was lowered to 12 µg/m3 from 15 µg/m3, and has remained unchanged as well. Since the Air Quality Index is tied to the NAAQS, this means that the cutoff for the Code Orange threshold was adjusted as well.
Different Forms for Different Pollutants
The two pollutants forecasted by the North Carolina Division of Air Quality – PM2.5 and Ozone – have differing short-term averaging times. Ozone has an 8-hour averaging time, whereas PM2.5 is a 24-hour averaging time. This is why you will occasionally see language in our forecast discussions indicating that highest concentrations are expected during a certain time of day, such as elevated PM2.5 in the morning due to a surface temperature inversion or high ozone concentrations in the afternoon when solar radiation is at its peak. Occasionally, 1-hour averages of these pollutants can fall within a range (or rarely two!) higher than what is forecasted/what verifies at a monitor for a net daily maximum AQI, so if you are unusually sensitive to air pollution it’s always a good idea to read our forecast discussion on a day where the AQI is expected to be Code Yellow or higher.
For more information regarding each criteria pollutant and the NAAQS, please visit https://www.epa.gov/criteria-air-pollutants . Stay tuned for future posts to learn how we monitor air pollution across the state of North Carolina in a future post! Please check our forecast page (https://xapps.ncdenr.org/aq/ForecastCenterEnvista) for more details regarding what’s happening with North Carolina’s day-to-day air quality, including a written discussion with the details that inform our forecast. Also, you can follow us on twitter to stay up to date with the daily forecast and alerts (https://twitter.com/NCDAQ_Forecast).