That feeling of spring in the air will soon be joined by powdery puffs of pollen, some sniffs of smoke, and potentially even occasional unhealthy air pollution as the weather continues to warm up.
March marks not only the start of meteorological spring, but also the beginning of ozone season, which runs from March 1 through October 31. As we’ve discussed before, the North Carolina Division of Air Quality (NC DAQ) issues daily Air Quality Index forecasts during ozone season for ground-level ozone, which can cause adverse health effects at high concentrations, in addition to year-round forecasts for fine particulate matter.
2021 Air Quality in Review
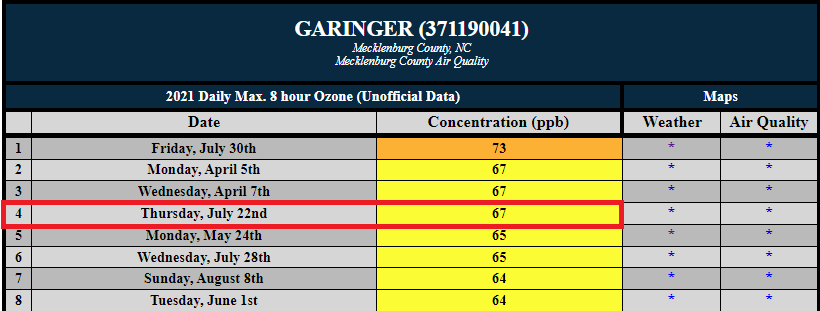
Last year, North Carolina continued to enjoy clean air quality on the vast majority of days. During ozone season in 2021, there were only two days (May 24 and July 30) on which any monitors in the state measured daily ozone concentrations that exceeded the standard set by the EPA for healthy air quality.
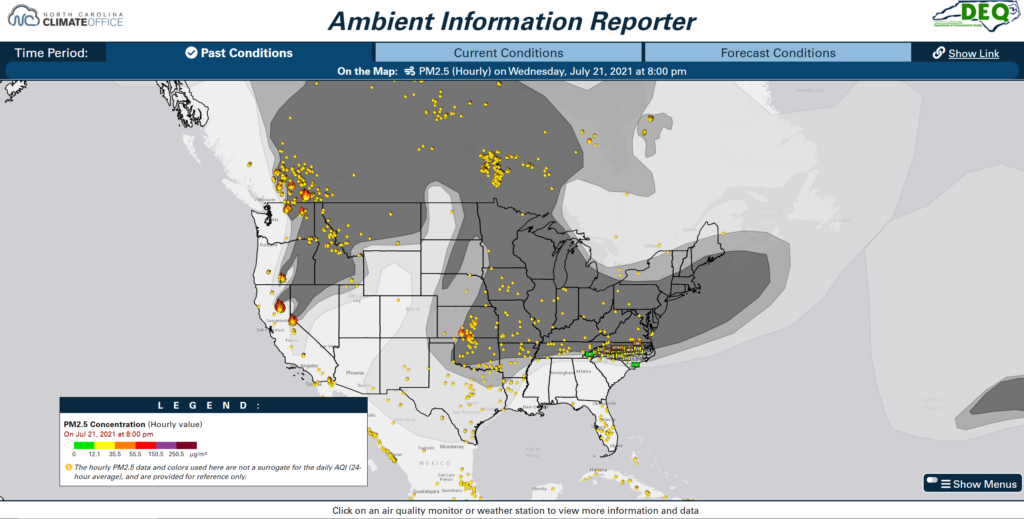
Two other days (July 4 and July 21) had air quality impacts from fine particulates due to smoke from very different origins, as discussed in a previous post that introduced our newest air quality tool, the Ambient Information Reporter.
Most notably, smoke from wildfires over the western US and central Canada was carried by the upper-level winds into North Carolina in late July. That largely reflects the recent evolution of our air quality: locally, conditions have gotten much better, but we still have to be wary of the air we share with other regions.
Recent Air Quality Trends
Indeed, air quality in North Carolina continues to improve, and we can assess that change using ozone design values. A design value is a statistic that describes the air quality status of a given location relative to the level of the National Ambient Air Quality Standards (NAAQS), as set by the EPA. Ozone design values are calculated using the three-year average of the fourth-highest daily 8-hour average ozone concentration measured at an air quality monitor.
Several factors – including (but not limited to) better fuel efficiency for automobiles, better industrial controls, and tighter environmental regulations – have resulted in decreasing design values and lower levels of the precursor emissions needed for ozone formation.
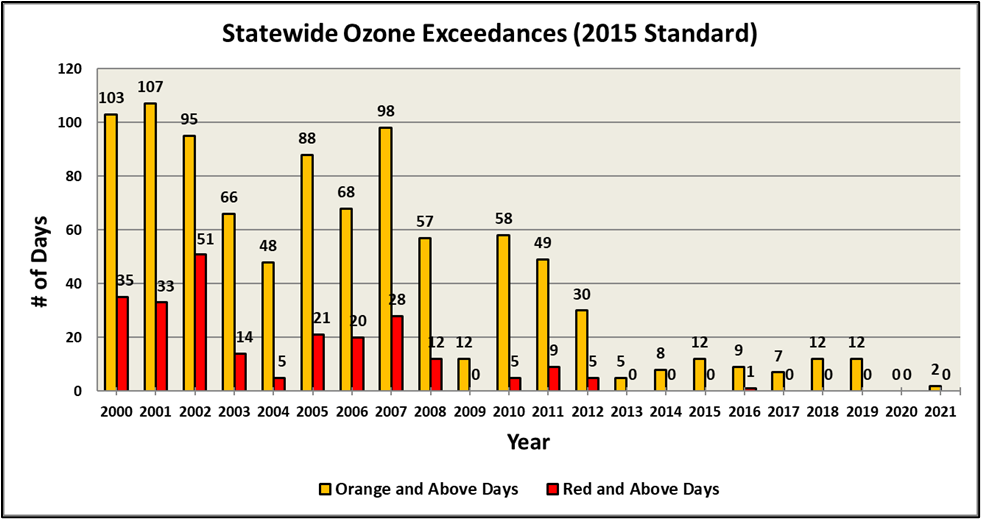
As ozone levels have decreased, there have been fewer exceedance days as well. At the turn of the millennium, we averaged 100 or more Code Orange days per year, with roughly a third of those days reaching Code Red, or Unhealthy, levels.
Beginning around 2012, exceedance days became rarer, with only a handful of Code Orange days per year, on average, and only one day reaching Code Red levels since 2013. You can learn more about North Carolina’s ozone design values, and even how they compare to other states, by exploring our Ozone Design Value Predictor tool.
Our Evolving Ozone Climatology
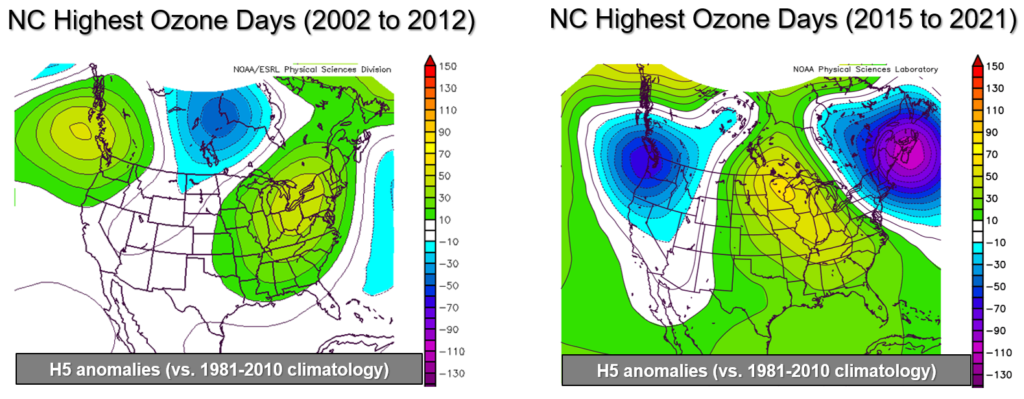
Along with the well-documented reduction in precursor pollutants such as nitrous oxides (NOx) and volatile organic compounds (VOCs) that result in ozone formation, the meteorological patterns that often accompany our highest ozone concentrations have also changed compared to a decade or more ago. While a broad area of high pressure was once enough to create ozone concerns, it now takes a more specific setup to trap sufficient quantities of ozone-producing pollutants across North Carolina.
Indeed, those high-ozone days were easy to pick out historically. Any time an area of high pressure (at the surface and aloft) formed over the eastern US during the summer months, some parts of the state were likely to experience an increase in daily ozone concentrations.
The exact position and strength of the high pressure wasn’t all that important; as long as skies were sunny and winds were light, ozone concentrations could rise significantly due to much higher daily NOx and VOC emissions from less-controlled (at the time) pollution sources such as power plants and automobiles.
Along with a decline in ozone precursor emissions – especially NOx – in recent years, we’ve observed that a different atmospheric pattern is now responsible for many of our highest-ozone days in North Carolina.
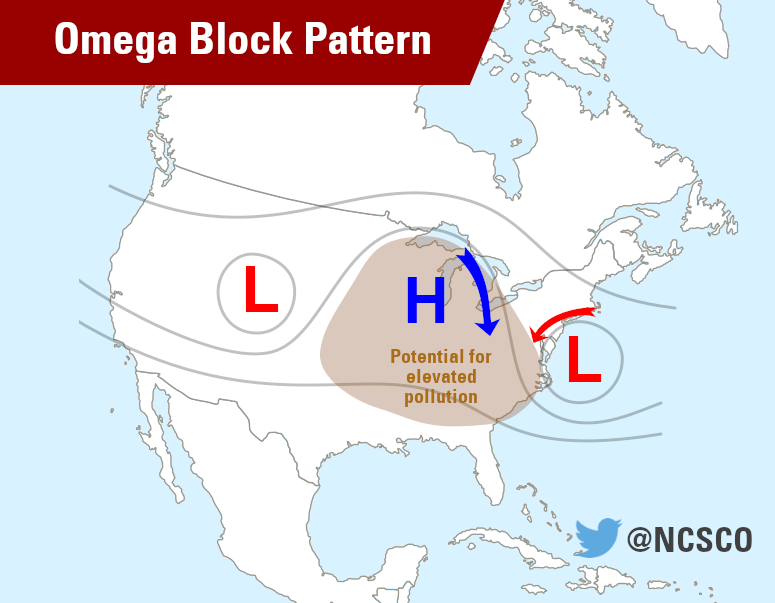
Referred to as an “Omega block”, this pattern is aptly named due to the way it is configured: an area of high pressure becomes surrounded by low pressure on both sides, resembling the Greek letter omega.
Omega blocks are notorious for featuring prolonged periods of warm and dry weather due to the sinking air associated with high pressure. Additionally, the air masses underneath the high pressure often become trapped due to the inherent inward-rotating circulation pattern. This can lead to air mass stagnation and an increase in pollution, not only beneath the area of high pressure, but also downwind of the area between the high and the eastern-positioned low pressure system, where pollution can sometimes be funneled southward.
The observed pattern shift during North Carolina’s high-ozone days in recent years is likely a direct result of our improving air quality. Due to the reduction in precursor emissions, it now takes a much longer period of air mass stagnation before enough precursors can build up to produce elevated ozone concentrations.
A New Era Of Sharing NC Air Quality Information
As part of the ongoing partnership between the State Climate Office and NC DAQ, we are thrilled to announce the launch of our latest collaborative resource: the Air Quality Portal. This will be the new hub for accessing NC DAQ’s daily air quality forecasts and discussions, along with a collection of tools, research, and educational information about the past, present and future of the air we breathe.
We hope that this one-stop shop will serve both the public and professional air quality communities. From sharing what it’s like outdoors today to showing local changes in air quality over the past decade, the Air Quality Portal will have the answers.
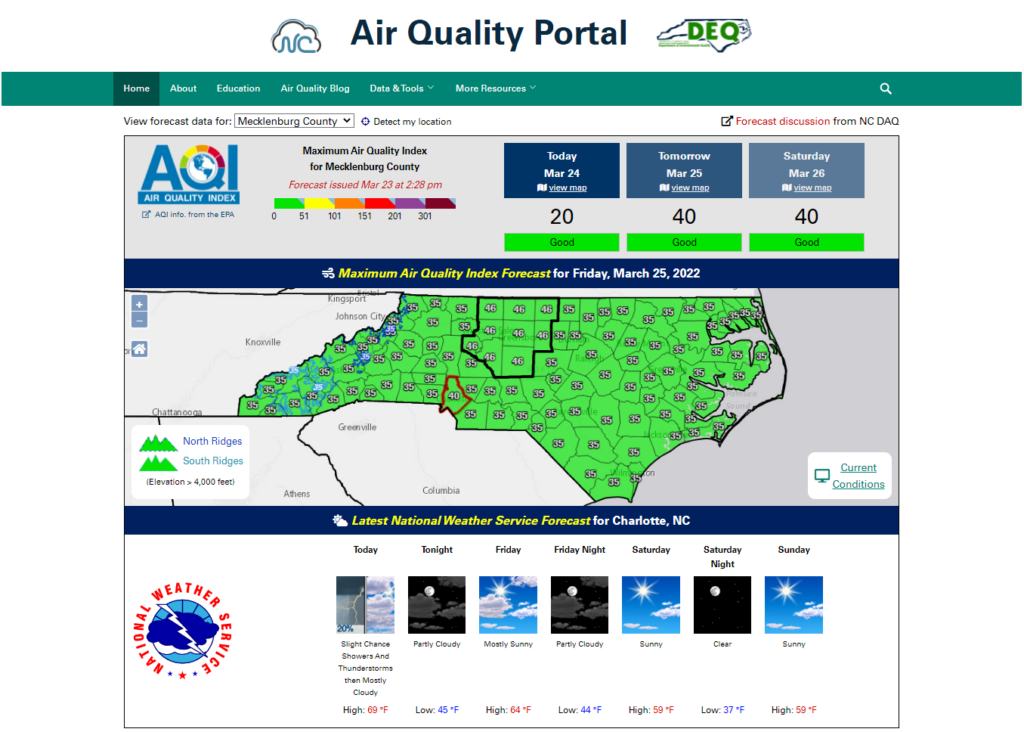
A number of existing tools – including the Ambient Information Reporter and our recently revamped Wind Rose Tool – are already available in the Air Quality Portal. It will even have a blog of its own, written by NC DAQ forecasters, with air quality insights this ozone season and beyond.
While the frequency of high-ozone days has dramatically decreased over the last decade, during those times when the air still isn’t as fair, we can turn to our wealth of air quality and weather observations, along with the knowledge we’ve gained in recent years, to provide more precise, accurate, and informative forecasts for North Carolina.