This multi-part blog series highlights several common sources of PM2.5 data with the intent not to endorse or dismiss any particular platform, but to suggest how to use these various tools together to assess your local air quality conditions, while recognizing their individual strengths and limitations. If you missed Part 1 of this blog series, you can find it here.
Low-Cost Sensors (like PurpleAir, Clarity, etc.)
NCDAQ’s air quality monitors have a big price tag – they can cost upwards of $100k to get up and running. Low-cost sensors, on the other hand, are a fraction of that price, and can be purchased and installed by anyone, effectively filling in the gaps over areas that do not have an official regulatory monitor. There are many commercial brands marketing these sensors, but we’ll focus on PurpleAir. PurpleAir has become very popular in recent years as a crowdsourcing platform for air quality data and for encouraging participation from citizen/community scientists.
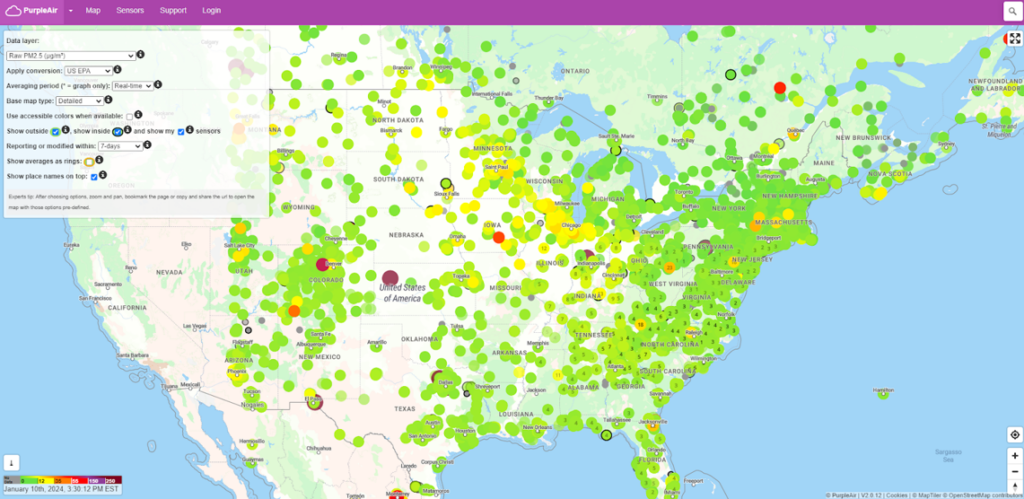
PurpleAir’s website provides a map that can display a variety of particulate matter data in either concentration (µg/m3) or equivalent AQI on a variety of time scales (real-time, 10-minute, hourly, daily, etc.) with the real-time data refreshing every 2 minutes. The spatial coverage is limited only by the amount of sensors purchased and installed by consumers.
That’s great! But a big caveat here is that PurpleAir sensors use lasers to measure PM2.5 concentrations, which tend to measure higher values than reality for smoke. Filters and filter media are used in most regulatory monitors and are far more accurate. This is why there’s an option within the PurpleAir map to Apply Conversion to your data layer. There are several different bias correction factors that you can apply that come from the U.S. EPA and other studies that attempt to identify and correct any measurement biases.
Another reason to be cautious using this data is the fact that there is no governing body providing oversight into the installation, calibration, or maintenance of this equipment. There are guidelines provided, but no reliable way to know the accuracy of one particular monitor in someone’s backyard, keeping in mind that the devices are sensitive to changes in temperature, humidity, and the type of PM2.5 being measured (i.e., wildfire smoke versus gravel dust).
Low-cost sensors are absolutely useful to get a broad sense of the air quality in an area, and to monitor if values are increasing or decreasing with time especially during volatile events like we saw during the 2023 Canadian wildfires. Single points of PurpleAir data, however, should not be considered the ultimate source of truth especially if significant discrepancies exist between it and regulatory monitoring data. Check out our Air Sensors FAQ page for more information on low-cost sensors.
The table below is a summary comparing NCDAQ’s data with PurpleAir. Next up, Part 3 of this blog series will discuss the EPA’s NowCast in detail.
| PM2.5 DATA SOURCE | How is data collected or produced? | Time Scale(s) | Units of Measurement | STRENGTHS | LIMITATIONS |
| NCDAQ Forecast and Discussion | Produced daily by a team of experienced meteorologists | 24-hour average (midnight to midnight) | U.S. EPA AQI (“Air Quality Index”) | Takes into account all available data including but not limited to current observations and trends, satellite imagery, meteorological and photochemical models, etc. to craft the best-possible forecast Detailed information and descriptions of current and future air quality conditions written by real people 365 days a year | County-level spatial coverage AQI forecast is daily, not “real-time” |
| NCDAQ Data | Measured on regulatory monitors | Hourly average or current daily average for concentration data 24-hour average value for AQI data | µg/m3 (“micrograms per cubic meter”) for current or past days U.S. EPA AQI for past days | Monitors are installed, calibrated, maintained and audited by a dedicated team of NCDAQ staff Measures using filter media, the most accurate method Data goes through rigorous quality assurance processes AIR Tool displays fires and smoke plumes in addition to measurements AIR Tool displays the official AQI number used in regulatory reporting | Limited spatial coverage of monitoring stations Cost prohibitive Data is not “real-time” |
| PurpleAir | Measured on low-cost sensors | Real-time 10-min 30-min 1-hour 6-hour 1-day 1-week 1-month 1-year | U.S. EPA AQI or µg/m3, depending on what is selected | Wide spatial coverage “Real-time” data is refreshed every 2 minutes Can apply a conversion factor to account for sensor biases | Uses a laser to count particles, which are less accurate and typically read higher than regulatory monitors Can be installed incorrectly or located improperly Unknown calibration and maintenance history |