Air Quality Forecasting
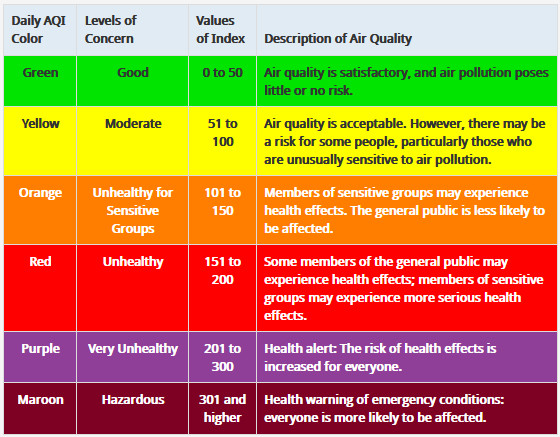
As we have touched on in other posts in the past, the North Carolina Division of Air Quality (NCDAQ) is responsible for preparing the daily air quality forecast for 91 counties. The Forsyth County Office of Environmental Assistance and Protection (FCEAP) prepares the daily forecast for the remaining 9 counties in north-central North Carolina. The NCDAQ and Forsyth County forecast teams work together to prepare the statewide forecast each day. We use the Air Quality Index (AQI), which details how good or bad the air is for both ozone and fine particulates, using an easy-to-understand numerical and color-coded scale (much more on the AQI in an earlier NCDAQ blog post).
NCDAQ does everything it can to ensure our air quality forecasts and alerts are reaching everyone in North Carolina. The relationships we have with other parts of the weather enterprise, including and especially our counterparts at the National Weather Service, are critical to achieving this goal.
In this post, we’re going to talk about how we at the Division have built state-of-the-art tools to display our air quality forecast data and how we collaborate with the National Weather Service to get this data into your hands so you can be Air Aware and Prepared!
Air Quality Portal: North Carolina’s One-Stop Shop for Air Quality Data
The Division, in partnership with our colleagues at the North Carolina State Climate Office, recently launched our next-generation Air Quality Portal, the Division’s one-stop shop for all observed and forecast air quality data that our Division produces every day! Here, you can find the air quality and weather forecast for any location in North Carolina, as well as current air quality and weather observations from across the state, as the figure illustrates below:
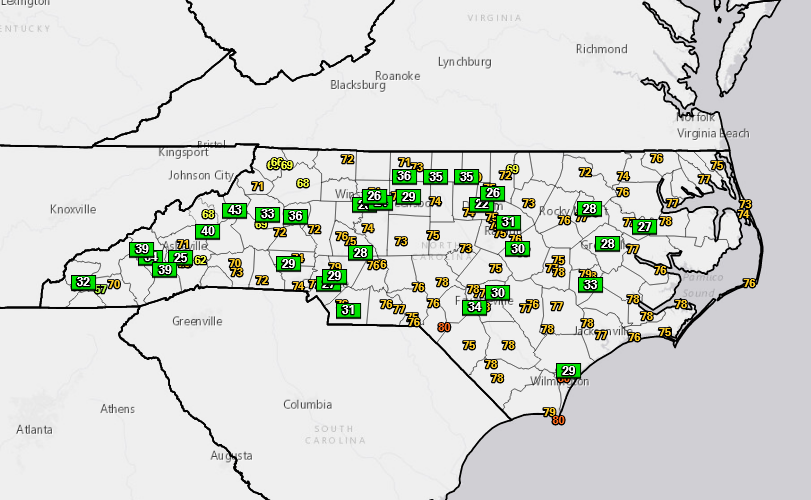
You can also find our blog posts, links to our in-house modeling guidance, Ozone Design Value Predictor Tool, and much more to keep you Air Aware and Prepared.
Partnership with the National Weather Service
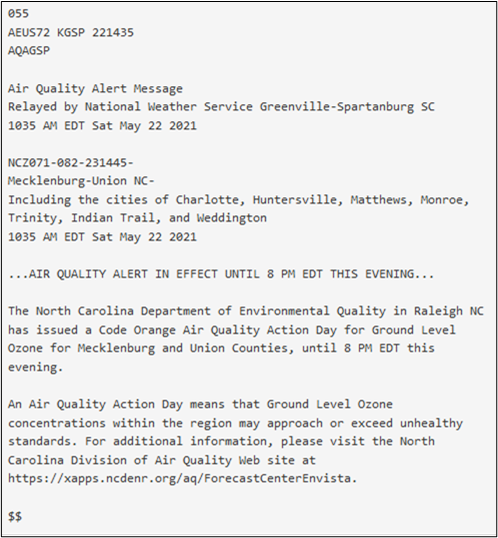
The National Weather Service and its field offices here in Raleigh and elsewhere across North Carolina are key partners in helping the Division’s and FCEAP’s air quality forecasts and alerts reach the public. As one of our past blogs details, we issue air quality forecasts for (with the exception of the Triad area) all counties in our state. These forecasts are relayed daily by the National Weather Service in Raleigh for its warning area, which covers most of central North Carolina.
If air quality is especially bad – that is, Code Orange or worse – then we will issue an Air Quality Alert for the area and pollutant we are concerned about. In addition to our social media and websites that we post alerts to, we coordinate closely with the National Weather Service and its commanding offices that oversee any counties in North Carolina as a part of their County Warning Area (CWA) to relay our alerts through the National Weather Service’s website and alert-dissemination capability.
Additionally, we work with our counterparts at the National Weather Service to educate them about the details and mechanics of air quality forecasting. These mechanics share some similarities with how NWS meteorologists prepare their forecasts – both NWS and NCDAQ pore over weather data and build weather forecasts that meet each agency’s specific needs – but air quality forecasting is its own unique challenge. This information-sharing provides each agency with the additional tools to support each other in achieving our missions. For the Division, it helps provide us with another set of eyes and ears, relaying reports of wildfires, smoke or other air quality concerns to us and reducing the time it takes for us to respond to an air quality problem. It also allows the Division to collaborate with the National Weather Service on the weather forecast that could inform a poor air quality event, discuss why poor air quality could be possible, and work together to produce a consistent message regarding air quality to share with the media and public.
Collaboration and consistent air quality messaging by both the Division and the National Weather Service helps provide you with better information to be Air Aware and Prepared!