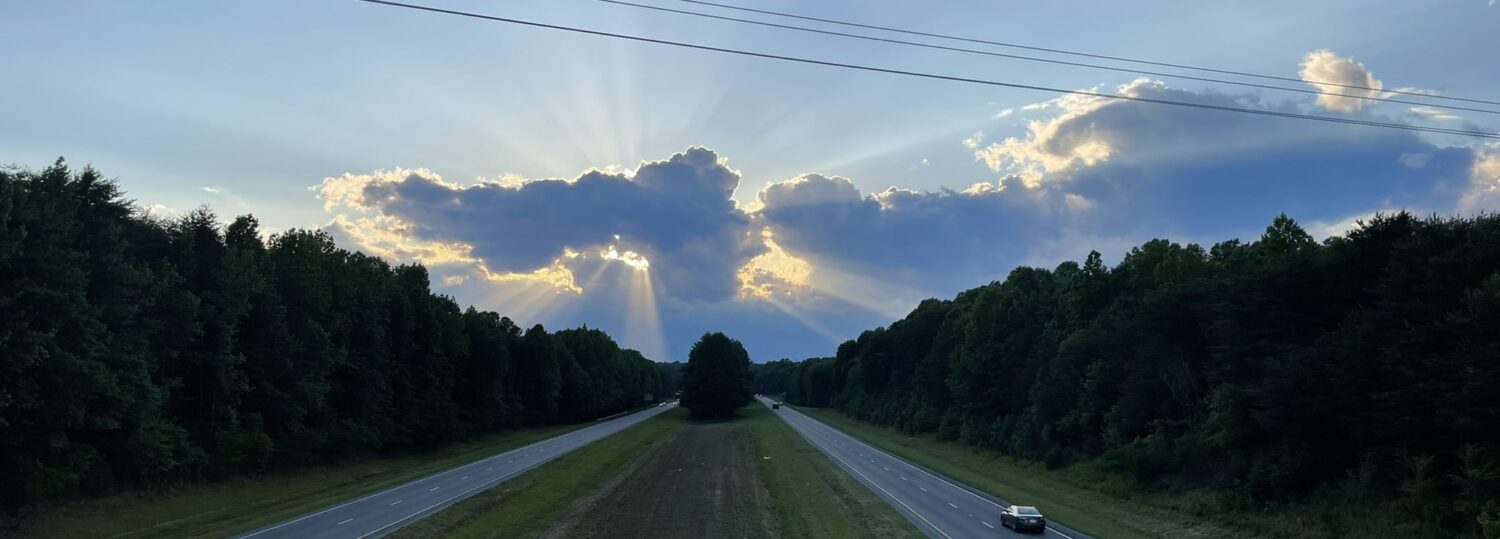
The foliage reaching its final form and the first freeze of the season – not to mention the calendar showing it’s now November – are all sure signs that the summer is finished.
This summer in North Carolina got off to a hot start but wrapped up right on time, at least by astronomical accounting. In between, we had several stretches of sweltering heat and even a few isolated air quality episodes across the state.
In this post, we’re teaming up with the NC Division of Air Quality to summarize our heat and ozone season, and officially rolling out a new and improved methodology for monitoring heat stress.
This Year’s Heat History
Summer’s sizzle blitzed across the state beginning with a particularly warm week in mid-May. On May 19, most of the state from the Foothills to the beaches saw temperatures climb into the 90s. That was the earliest occurrence of 90-degree heat in Hickory since 2010.
Hot weather continued during the following week as a common summer weather pattern, the Bermuda high pressure system, assumed its typical position off our coast and generated a flow of warm, humid air from the south.
The heat ramped up again in June. On June 13, our Sandhills ECONet stations in Hamlet and Lilesville hit 100°F, and even downtown Asheville made it up to 94°F – the hottest afternoon there since July 22, 2017. A week later on June 22, Charlotte topped out at 101°F, which was its first hundred-degree day since 2015.
Early July saw another stretch of prolonged heat, particularly across the eastern Piedmont. Raleigh reached 102°F on three consecutive days on July 6, 7, and 8, which wrapped up a brutal week there with an average temperature of 97.9°F. That was Raleigh’s hottest 7-day period since July 2012.
On July 6, the mercury climbed all the way to 104°F in Smithfield. According to our records, that was the hottest temperature in North Carolina in more than three years, since Dunn hit 105°F on July 3, 2019.
The dog days of summer rolled over into August this year, including 16 consecutive days with high temperatures at or above 90°F in Raleigh – tied for the 7th-longest such streak on record there.
That run of hot days eventually ended on August 12 as a cold front ushered in a cooler air mass from the north. However, summer still had another surprise in store in September, with record-setting daily highs in the upper 90s on September 22.
That night, our temperatures came crashing down just in time for the arrival of astronomical fall. Since then, seasonable to slightly below normal temperatures continued in October, and we avoided a stubborn summer like in 2019, which saw 90-degree heat lasting late into the season.
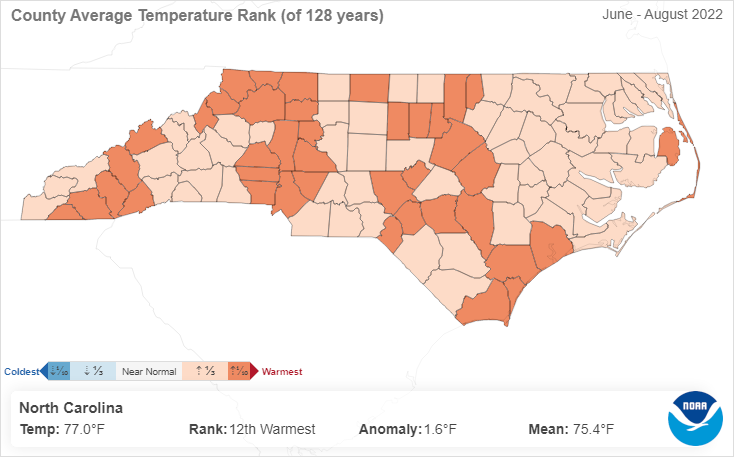
With a statewide average temperature of 77.0°F, the three-month period from June through August tied for our 12th-warmest summer on record, according to the National Centers for Environmental Information. It was our eighth summer in a row, and seventeenth out of the past 20 years, that was warmer than the 20th-century average.
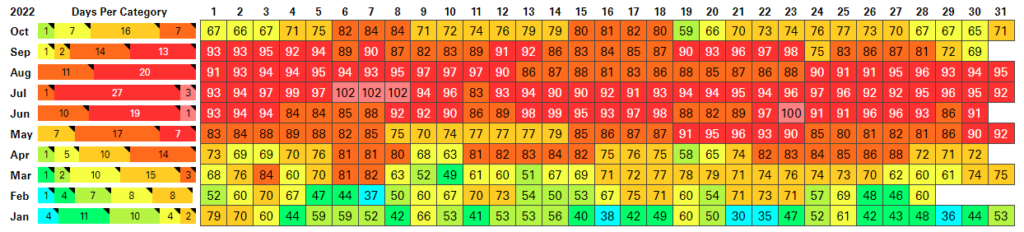
Of course, those three months alone don’t fully capture the coverage of our heat this year, which ran from mid-May until late September. Lumberton led the way with 83 days reaching 90°F or higher – tied for the 16th-most on record since 1903.
Raleigh had 81 days at or above 90°F, which was the 4th-most on record there and just 10 days behind the record pace set in 2010. And Wilmington had 58 days reaching at least 90°F, tied for the 12th-most on record there and the most since the record-setting 77 days in 2019.
Air Quality Impacts
Historically, one of the hazards that has often accompanied our summer heat has been poor air quality. Hot weather and ample sunlight jump-start chemical reactions with pollutants and naturally occurring volatile organic compounds (VOCs) in the lower atmosphere to form ozone, a microscopic molecule that can cause respiratory problems.
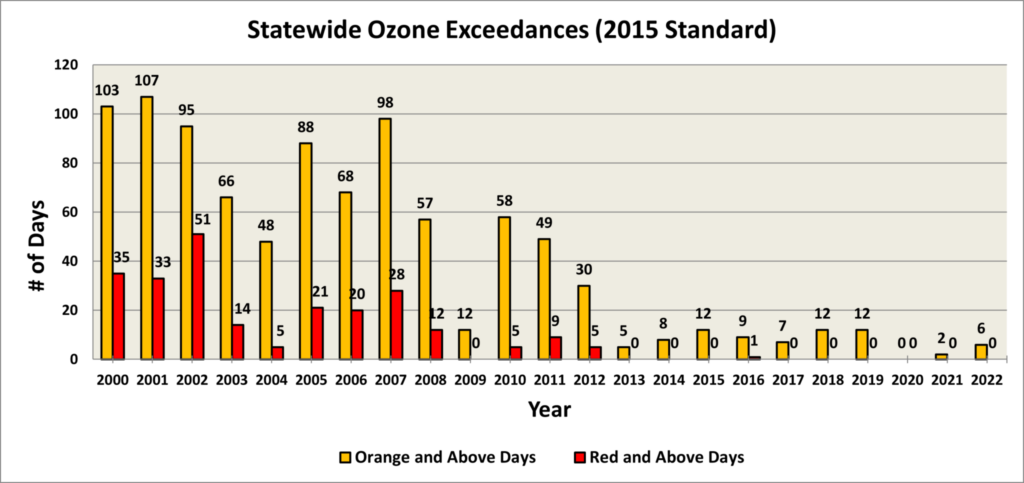
However, regulatory efforts to curb emissions in North Carolina have helped make high-ozone days much less common. Those positive air quality trends over the past decade largely continued this year.
During the ozone season from March 1 through October 31, there were just six days – March 3, May 18, June 6, June 21, June 22, and July 22 – on which the maximum 8-hour ozone concentration at any monitor across the state exceeded the health-based standard established by the EPA (70 parts per billion, or ppb).
The most significant ozone event this year happened on back-to-back days in June, and a familiar culprit was responsible. In our ozone season preview earlier this year, we discussed how Omega blocking patterns have been responsible for many of the highest ozone days observed across the state in recent years. That same feature formed to our northwest in mid-June.
As seen in the five-day average height anomalies, a strong upper-level ridge, or area of high pressure, developed in a favorable position for ozone formation and eventual transport over the upper Midwest by June 18, and it was flanked to the west and east by blocking areas of low pressure, giving a signature flow pattern resembling the Greek letter omega.
Beneath the area of high pressure, the air mass became stagnant with higher concentrations of pollutants trapped near the ground. That allowed daily ozone concentrations to elevate into the Code Red range at a few monitors along the shores of Lake Michigan by June 20.
As the entire Omega block complex slowly pivoted eastward, the clockwise winds around the high pressure combined with the counter-clockwise winds around the offshore low to funnel the polluted air southward into North Carolina.
Recognizing the potential for elevated ozone, forecasters with the NC Division of Air Quality issued Code Orange forecasts for Mecklenburg and Union counties for Tuesday, June 21. On that day, the Garinger monitor near downtown Charlotte recorded a maximum 8-hour ozone concentration of 75 ppb, within the Code Orange AQI range.
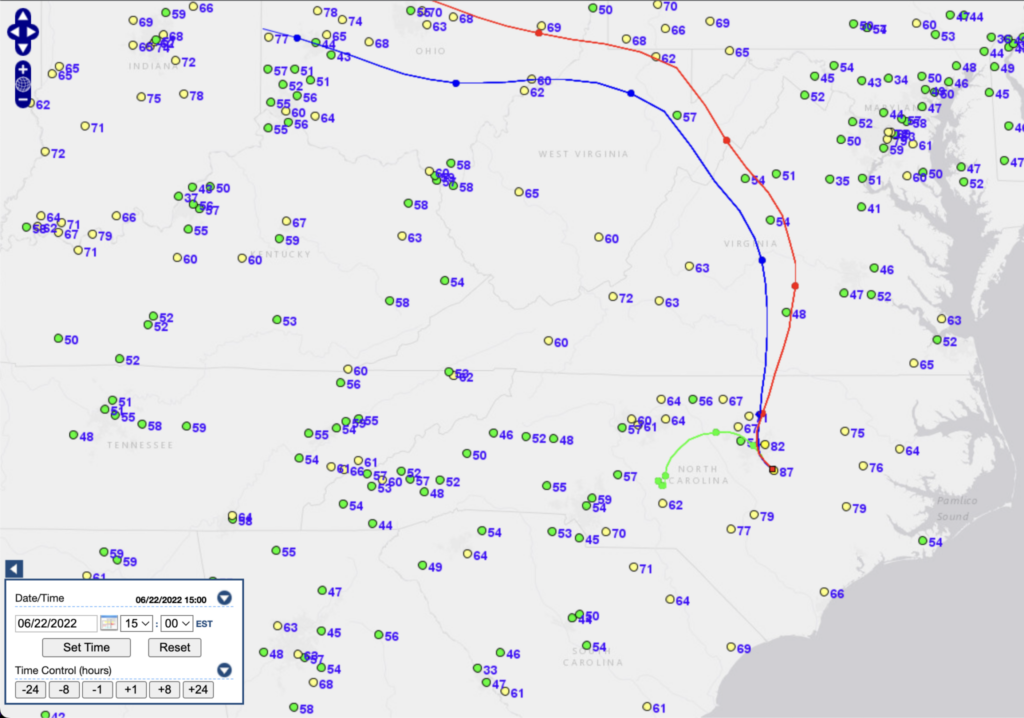
What happened the next day was even more remarkable. On June 22, several monitors in the eastern Piedmont and Coastal Plain – where ozone exceedances are quite rare – observed the highest ozone concentrations anywhere in the state for the entire ozone season.
The ozone monitor near Smithfield in Johnston County recorded its highest concentration in the past decade: 82 ppb, or the equivalent of 140 on the Air Quality Index. Atmospheric back trajectories show the air across that region originated from the Ohio Valley region, directly beneath the upper-level ridge and stagnant, polluted air mass.
As that feature shifted northeastward into Canada, air quality conditions improved back into the Code Yellow range by June 23.
Other than those active days in June, this ozone season was relatively clean and quiet. Unlike last summer, when far-flung wildfire smoke from the western US and central Canada reached North Carolina, there were no major intrusions of smoke or fine particulate matter this year.
That makes 2022 another testament to our improved air quality, and hopefully a sign of more clean air to come.
A Better Way to Monitor Heat Stress
Of course, summer isn’t totally free from outdoor hazards. Any time the temperatures climb, heat stress is a concern, particularly for those working or exercising outdoors, often in direct sunlight during the hottest part of the afternoon.
You’ve probably become accustomed to hearing the heat index used to describe how hot it feels, but despite its long history of use, the heat index is not the best indicator of heat impacts on the human body.
Because it is calculated using the air temperature and relative humidity as measured in a shaded, shielded enclosure, it does not reflect the extremity of heat as felt in direct sunlight. It also doesn’t include other weather elements that can affect how humans perceive the heat, most notably winds and the sun angle.
Enter the Wet Bulb Globe Temperature, or WBGT. It was first used by the US Army and Marine Corps in the 1950s to monitor heat illness among military trainees, and has since seen more widespread adoption and applications, including by the North Carolina High School Athletics Association as a guideline for outdoor sports.
So why hasn’t it seen even greater acceptance? The three main obstacles to using WBGT are measuring it, calculating it, and interpreting it. Here’s how each of those are done, and how you can access and use WBGT whenever the heat ramps up again.
Measurement
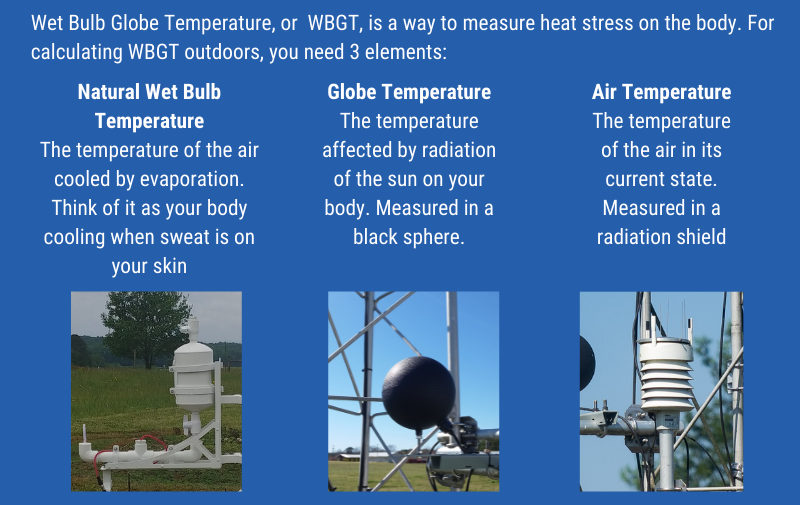
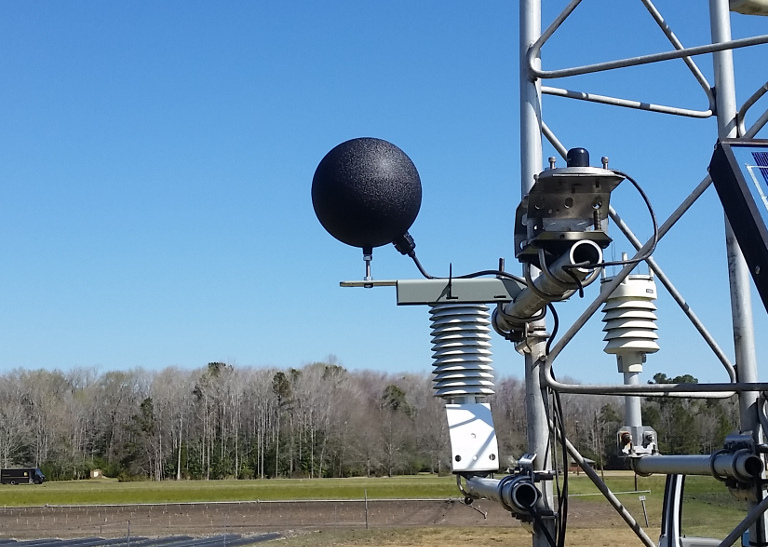
For the most accurate results, WBGT needs temperature measurements made using special instrumentation called a black globe thermometer. As the name implies, this sensor is located inside a black-painted sphere, which absorbs sunlight and offers a better indication of ambient, unshaded temperatures. Earlier this year, we completed the installation of these sensors at all 44 of our ECONet stations across the state.
Calculation
Along with the black globe temperature, WBGT calculations require the standard, shielded air temperature and the wet bulb temperature, which is the lowest temperature to which the air can be cooled by evaporation alone. (Think of this as representing the cooling effect a nice breeze has as it evaporates the sweat on your skin.)
As with heat index or even chocolate chip cookies, there are a few different ways to combine these ingredients and get a reasonable result. We have evaluated several different methods and found that one developed by Timothy Boyer at NOAA’s Meteorological Development Laboratory best reflects conditions in North Carolina.
It’s also the method used by the National Weather Service’s graphical forecasts, so our ECONet-based WBGT calculations should be directly comparable against these forecasts.
Interpretation
At first glance, WBGT values may look a little underwhelming and even unconcerning. After all, the highest values only tend to be in the low 90s, while we can see heat index values climb well above 100°F on our hottest summer days.
Remember, though, that WBGT is akin to a wet bulb temperature, which is a balance between the ambient air temperature and the dew point. That means the values will be a bit lower than you might expect compared with the heat index or even the observed air temperature.
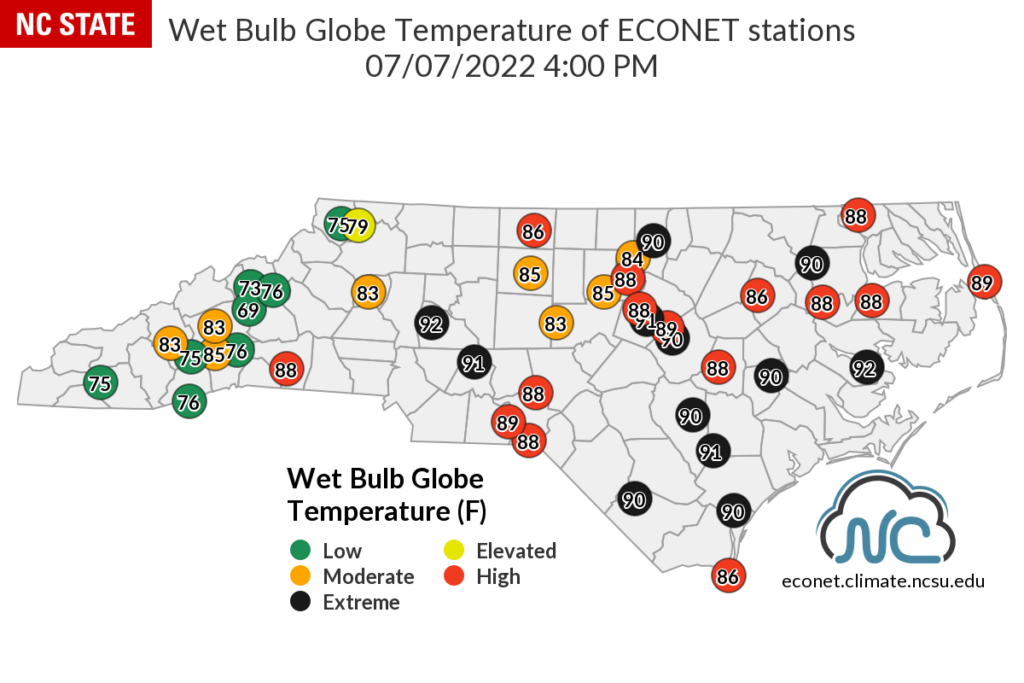
As an example, on July 7 at 4 pm, our ECONet station in Salisbury measured an air temperature of 96°F, a black globe temperature of 120°F, and a dew point of 75°F. While the heat index at that time was 109°F, the WBGT was 92°F, which was one of the highest values in the state all summer.
Fortunately, you don’t need to totally retrain your brain to contextualize these WBGT values. That’s because they’re often color-coded and even come with descriptions of their human heat stress impacts and recommended actions.
For instance, any WBGT value at or above 90°F falls within the Extreme category, which can cause stress after less than 15 minutes of working or exercising in direct sunlight. In those conditions, it’s recommended to spend at least 45 minutes out of each hour taking breaks — and the North Carolina High School Athletics Association guidelines require suspending outdoor activities in Extreme conditions.
WBGT data is now easier than ever to find and use. It is included – and has been updated to use the NWS methodology – in our Cardinal data retrieval system, on our ECONet WBGT monitoring page, and in the Ambient Information Reporter tool within our Air Quality Portal.
While we’ve put the hot weather behind us for a few months, it’s sure to return again by next summer, or perhaps even next spring if it follows this year’s example. When that happens, WBGT can inform your outdoor activities and help you beat the heat.