Since launching the AIR tool in 2021, we have had the opportunity to use it during numerous high ozone and fine particulate events with origins of influence ranging from local wildfires to wildfire smoke transported all the way from Canada.
The tool has been utilized by both the media and the public to identify and share times of poor air quality. In a more technical application, the AIR tool was also utilized by NC DAQ and the EPA to analyze the impacts of Canadian wildfire smoke on North Carolina’s ability to attain a revised, strengthened PM2.5 standard that was promulgated in 2024.
With those past events in mind and with an eye toward the future to make sure we continue to meet the new healthy standard as a state, we’ve updated the AIR tool to add in new data, new displays, and new summaries to enhance our ability to track the air quality.
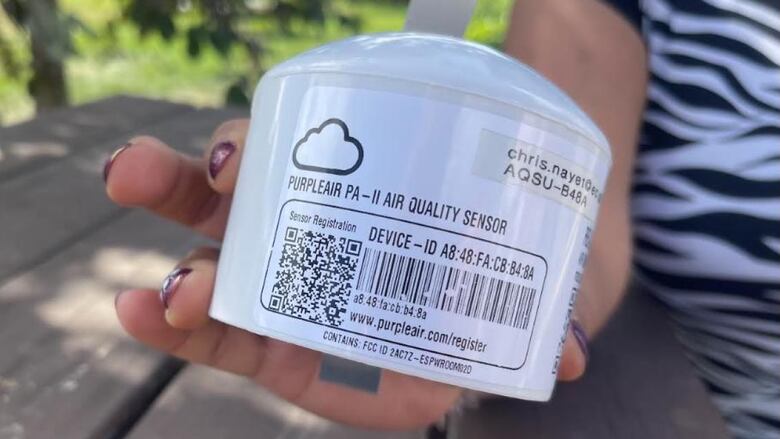
PurpleAir Sensors
Previously, we discussed how inexpensive fine particulate (PM2.5) sensors such as those distributed by PurpleAir could fill in both spatial and temporal data gaps across the state, but at the cost of some accuracy and reliability. In addition, we noted that another reason to be cautious using this dataset was that no governing body has the resources to provide quality control and assurance (QA) of the sensors.
However, due to the potential benefits of having a vast network of PurpleAir sensors — that notably offer updates as frequently as every 2 minutes — work has been ongoing in the air quality community, led by the EPA, to create bias correction algorithms that could calibrate the raw PurpleAir sensor measurements. The goal has been to more closely align the PurpleAir measurements, which have significant known biases, to the more accurate (and much more expensive) regulatory monitors that state and local air quality agencies operate nationwide. Thus far, the results have been promising, but not perfect.
In an evaluation of U.S. EPA’s correction equations for PurpleAir sensor data, the authors note that: “Using the Barkjohn 2021 and new EPA correction algorithm for PAS [PurpleAir Sensor] data, we find that the sensors give reasonably accurate results for PM2.5 for typical urban wintertime pollution and smoke events but give concentrations that are a factor of 5–6 too low for dust events.”
The good news is that for most fine particulate events that would ever impact North Carolina (including smoke), applying the EPA’s bias correction algorithm to raw PurpleAir measurements will yield observations that more closely align with NC DAQ’s regulatory monitoring network. However, in the rare case of a dust transport event, such as the one that impacted NC in June 2020, the PurpleAir sensors could report fine particulate concentrations that are significantly too low. Hopefully, future versions of bias correction algorithms can improve on this.
Nevertheless, by utilizing the EPA’s current bias correction algorithm, we feel confident that PurpleAir data can be presented with reasonable accuracy most of the time. Thus, we have elected to begin including this dataset (with the EPA bias corrections applied) alongside our regulatory PM2.5 monitors in the AIR tool for North Carolina.
During the development process, this data has already proven useful for NC DAQ’s forecasters during a busy spring wildfire season. When the Black Swamp fire began burning in the Croatan National Forest in late April, a nearby PurpleAir sensor in Maysville was the first monitor to pick up elevated pollutant concentrations – the Code Red, or Unhealthy range – which helped inform and validate adjustments to the local air quality forecast.
We are excited about the increase in both spatial (approximately 400 additional PM2.5 monitors in and surrounding NC) and temporal (PurpleAir sensor data will refresh every 10 minutes) resolution this brings to our fine particulate dataset. This will allow AIR tool users to have the most widespread and current air quality data available, resulting in increased awareness during high impact events, such as wildfires, that can result in elevated fine particulate concentrations across the state.
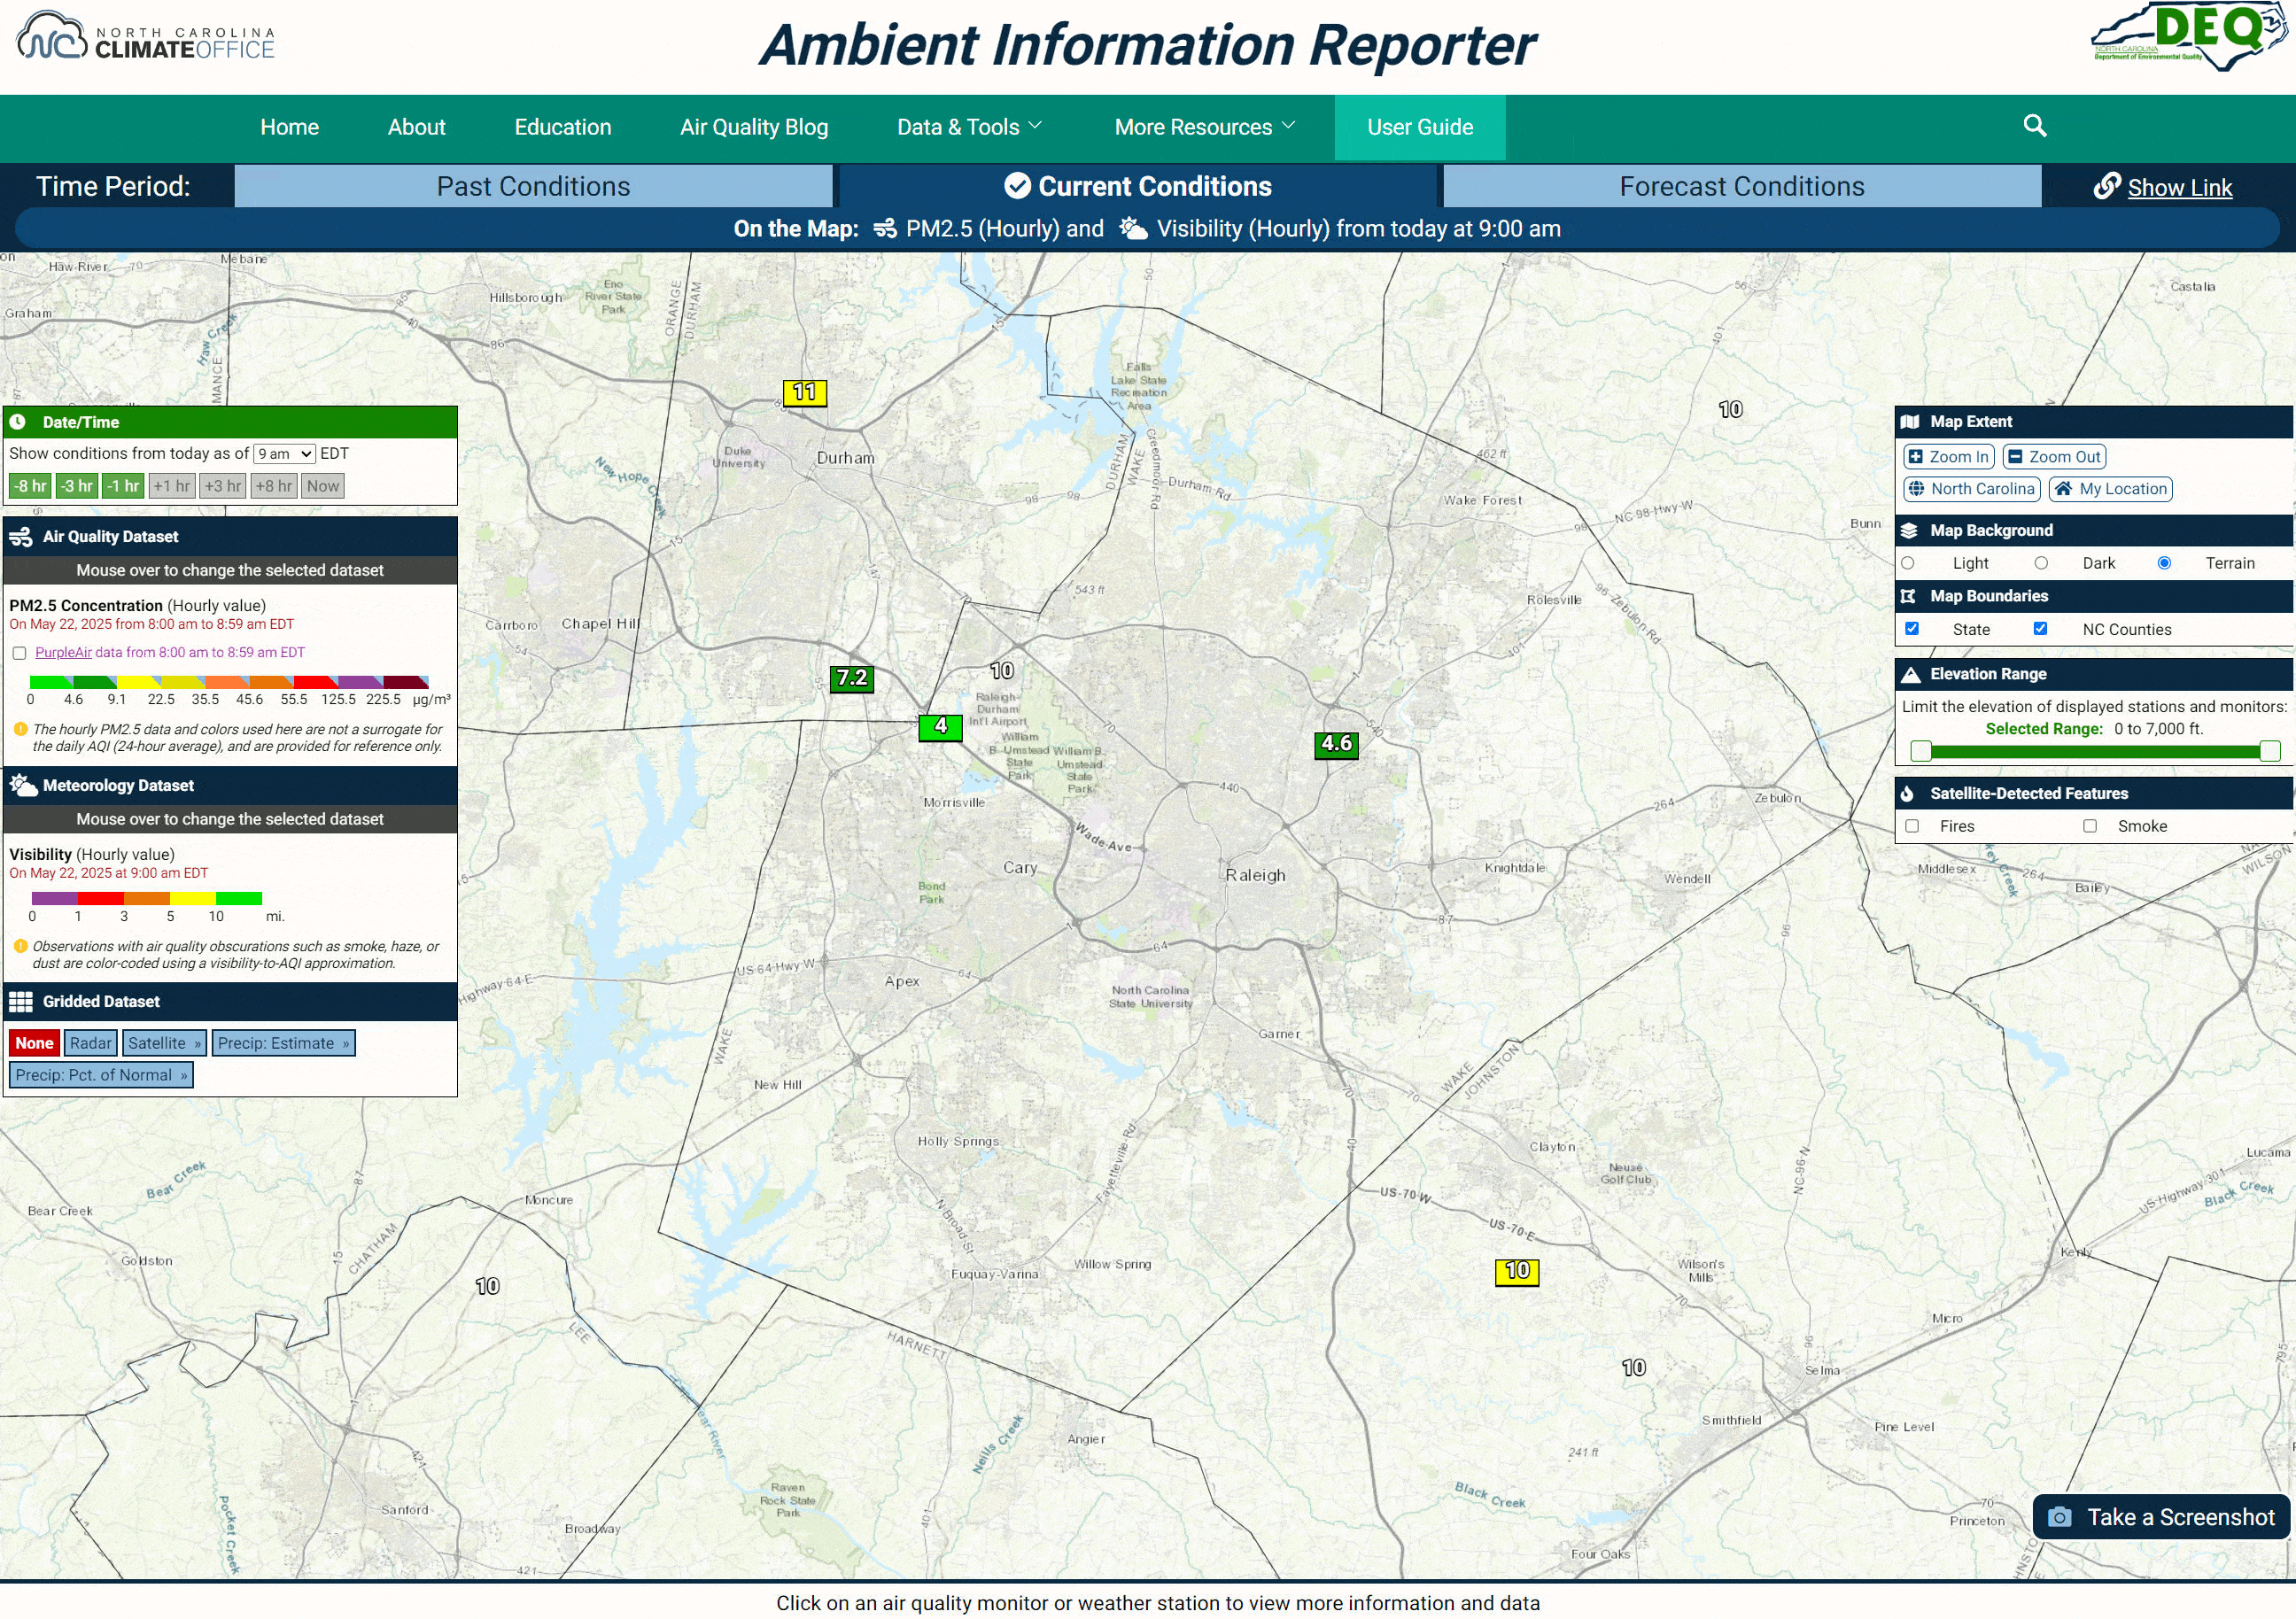
Visibility Data Curated for Air Quality
Ask any meteorologist if they’d like to have more data and they will emphatically say: “Yes, please!” Naturally, air quality meteorologists are no different. While North Carolina is fortunate to have a robust network of air quality monitors across the state, there will inevitably always be localized gaps in coverage.
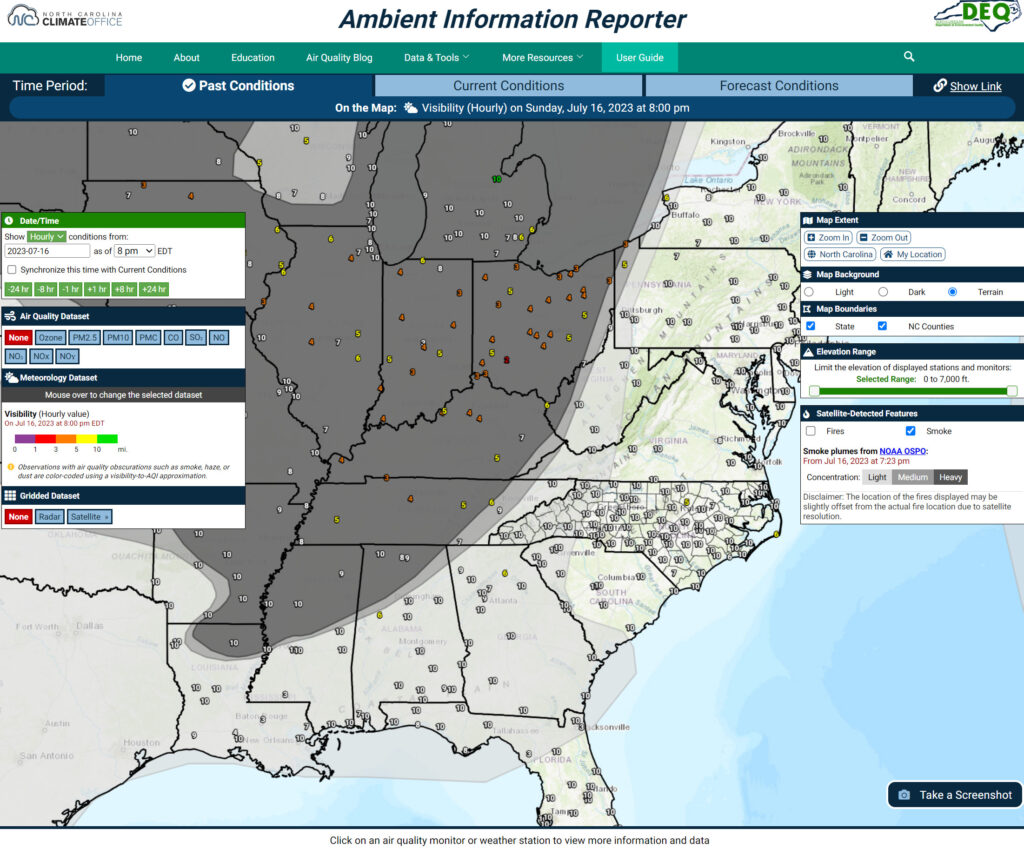
NC DAQ forecasters have often utilized surface visibility reports from nearby weather stations as a proxy for air quality monitoring data when an air quality event has occurred in a data-sparse location. Visibility reports can provide useful information about air quality, when used and interpreted correctly.
In the presence of an air quality obscuration (including: haze, smoke, dust or less commonly volcanic ash and sand), the amount of visibility reduction from the clear sky standard of 10 statute miles can be used to roughly approximate what the air quality is like at that location.
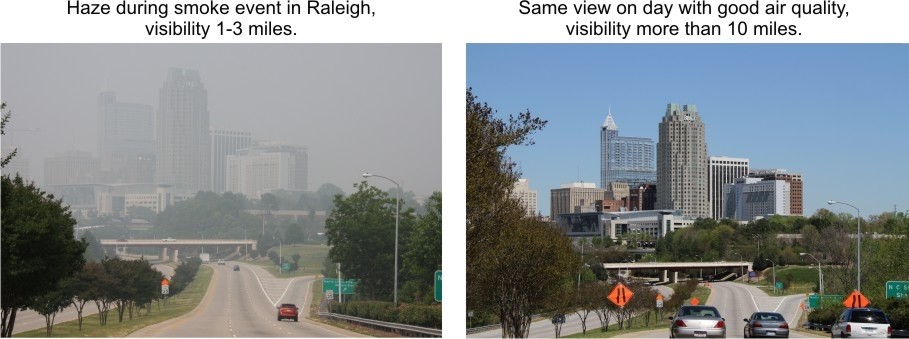
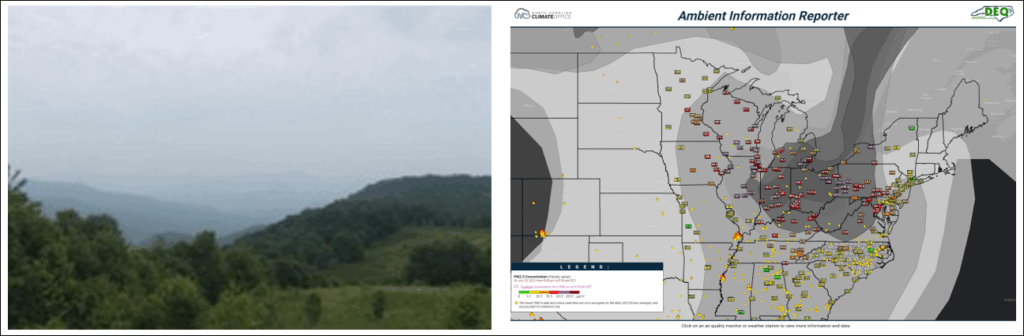
During the wildfire event that plagued the southern Appalachians in November 2016, DAQ’s then-Deputy Director (now Director) Mike Abraczinskas said: “If you can see heavy haze and smell smoke, then air quality is not good and you should limit your outdoor activities. This is particularly important for sensitive groups – that is, children, older adults, people with heart and respiratory problems, and those who work and exercise outside for extended times.”
Using past experience and expertise, NC DAQ developed a visibility guide to approximate what the Air Quality Index (AQI) would be based on the reported visibility in the presence of an air quality obscurant. As visibility lowers, it is an indication of a thicker concentration of whatever obscurant is degrading the air quality (such as haze, dust or smoke).
Now, the AIR tool will use the DAQ visibility guide to color-code visibility observations based on an AQI approximation scale only when an air quality obscuration is reported. When a station reports a visibility without an obscuration related to air quality, it will remain white. Reduced visibility while the air quality is good occurs frequently due to fog/mist and precipitation, which makes determining if a reduced visibility report is due to an air quality obscuration difficult without the logic we have developed.
This data display was also handy during the recent spring fire season. For example, smoke from the Rattlesnake Branch fire at Pisgah National Forest reached the Asheville area on March 28, decreasing the local visibility to 3 statute miles with haze reported.
The newly enhanced visibility layer will now be displayed as the default meteorological layer in the AIR tool, which means even more relevant air quality information will be available in an all-in-one display, which we discuss in more detail below.
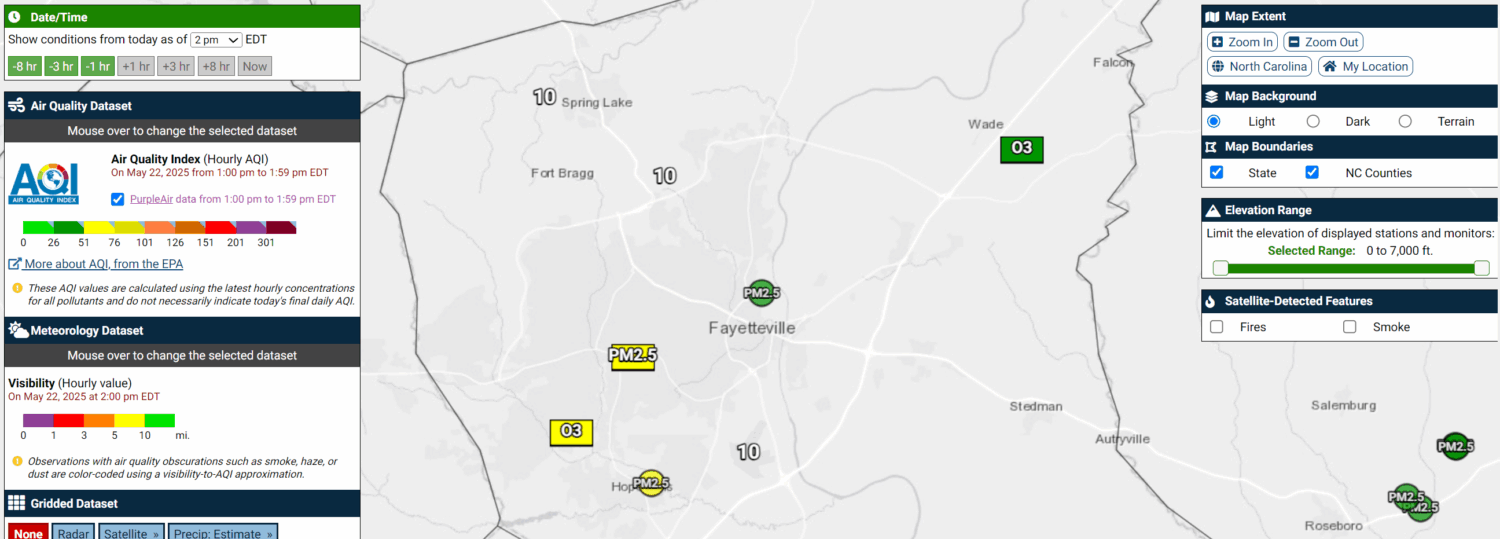
All-New Hourly AQI Layer
When we designed the AIR tool, our goal was to provide a modernized display for sharing reliable air quality information with the public that could quickly answer the question of: “What is my air quality like?” before stepping out the door.
Through years of use, we’ve realized that our goal hasn’t always been met. For example, during periods when the 2023 Canadian wildfires sent smoke into the state, the AIR tool’s default air quality layer (ozone) did not reflect the significant elevation in fine particulate concentrations that was occurring. If the general public didn’t know to switch air quality data layers, they may have falsely assumed the current air quality was much better than it actually was based on the default display, which was showing mostly Code Green ozone readings.
To rectify this, we have developed a new default layer for the AIR tool: the hourly AQI layer. This layer will display all air quality monitors in NC along with the current highest AQI value and associated pollutant at that monitor (recall some, but not all, monitors measure multiple pollutants such as ozone, PM2.5, PM10, SO2, NO2 etc.). If a monitor only measures one pollutant, then that will always be the pollutant shown in the hourly AQI layer.
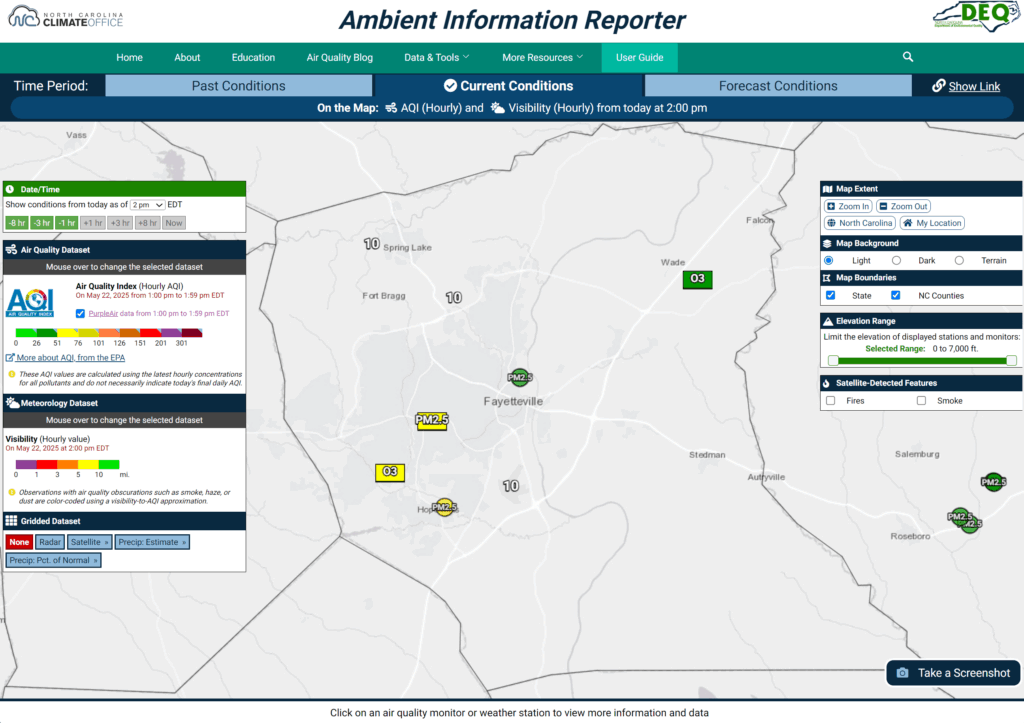
The new hourly AQI layer will highlight any air quality issues currently occurring, regardless of what pollutant is the culprit, and avoids the issue of only displaying one pollutant type by default. In combination with the new default visibility layer, we are excited about how much additional air quality information we are able to share at a glance!
More monitors + more data curation add up to what we believe will be a milestone moment for the AIR tool. Informing users of the condition of their air quality will now be easier than ever before. Finally, in addition to everything we’ve highlighted here, there are several more “under-the-hood” new features and performance improvements we’ve made. We encourage everyone to take a few moments to check it out and please share the tool with anyone you know who may be interested in getting accurate, reliable and timely air quality information in North Carolina!