By Jordan RootAn interesting air quality event may have happened during the morning hours of Friday, May 15. Two high elevation (ridge top) ozone monitors, one in... |Air Quality Blog
By Sara KreuserPrescribed fire season in North Carolina typically runs from late winter through early spring when trees and other vegetation are dormant. The season often peaks... |Air Quality Blog
By Jordan RootAs calendars flipped to November, the 2025 ozone season officially came to an end across North Carolina. The season, which runs from March 1 through... |Air Quality Blog
By Sara KreuserFolks just west of the Raleigh-Durham International Airport on Monday night may have seen or smelled smoke lingering into the early morning hours on Tuesday.... |Air Quality Blog
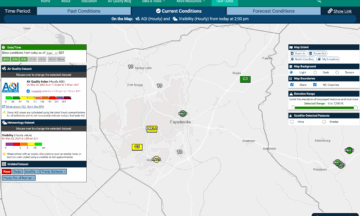
By Bradley McLamb and Corey DavisSince launching the AIR tool in 2021, we have had the opportunity to use it during numerous high ozone and fine particulate events with origins... |Air Quality Blog
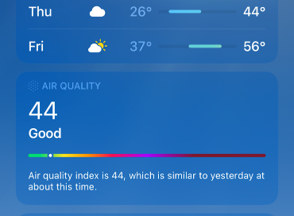
By Sara KreuserYou may have noticed over the past month that there seem to be more fine particulate (i.e., PM2.5) readings elevated into the Code Yellow “moderate”... |Air Quality Blog
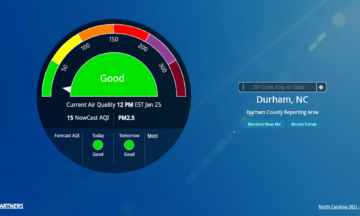
By Sara Kreuser and Bradley McLambThis multi-part blog series highlights several common sources of PM2.5 data with the intent not to endorse or dismiss any particular platform, but to suggest how... |Air Quality Blog
By Sara Kreuser and Bradley McLambThis multi-part blog series highlights several common sources of PM2.5 data with the intent not to endorse or dismiss any particular platform, but to suggest how... |Air Quality Blog
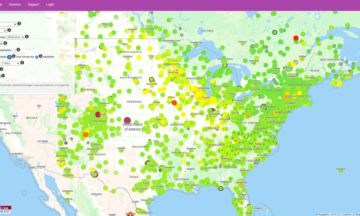
By Sara Kreuser and Bradley McLambThis multi-part blog series highlights several common sources of PM2.5 data with the intent not to endorse or dismiss any particular platform, but to suggest how... |Air Quality Blog
By Sara Kreuser and Bradley McLambThis multi-part blog series highlights several common sources of PM2.5 data with the intent not to endorse or dismiss any particular platform, but to suggest how... |Air Quality Blog
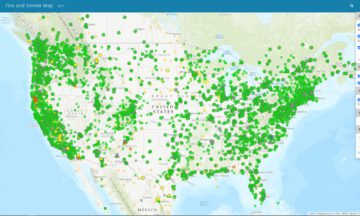
By Sara Kreuser and Bradley McLambIn 2023, an incredible 45 million acres (18.5m hectares) of forest burned in Canada. And last summer in particular, when the large-scale weather pattern was... |Air Quality Blog
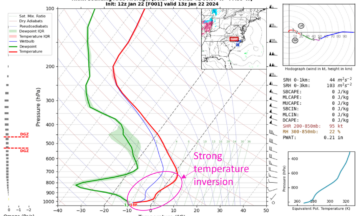
By Sara Kreuser and Bradley McLambIn a previous blog post, we discussed some unique characteristics of winter air quality. Namely, how fine particulate readings are often higher overnight and early...