By Heather WylieAir Quality Forecasting As we have touched on in other posts in the past, the North Carolina Division of Air Quality (NCDAQ) is responsible for... |Air Quality Blog
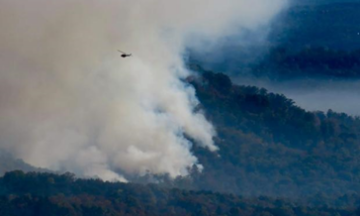
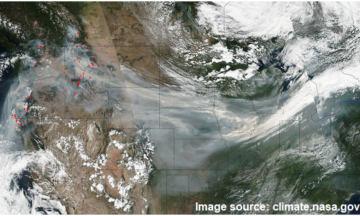
By Heather WylieWildfires Air Quality Awareness Week begins with a look at wildfires and smoke. A wildfire is a fire that is either unplanned or out of... |Air Quality Blog
By Bradley McLamb, Heather Wylie, Elliot Tardif and Corey DavisThat feeling of spring in the air will soon be joined by powdery puffs of pollen, some sniffs of smoke, and potentially even occasional unhealthy... |Air Quality Blog
By Heather WylieHave you noticed how fine particulate readings in the morning are often higher than the afternoon during the winter months? This is often due to... |Air Quality Blog
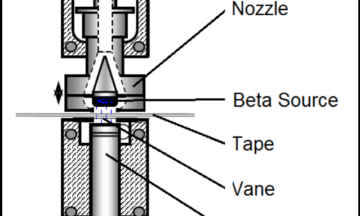
By Heather WylieEarlier this month we discussed the National Ambient Air Quality Standards (NAAQS), but how do we measure air quality to ensure our air is within... |Air Quality Blog
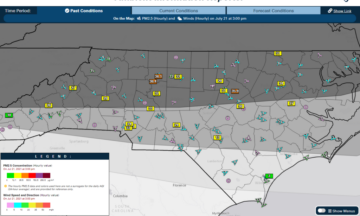
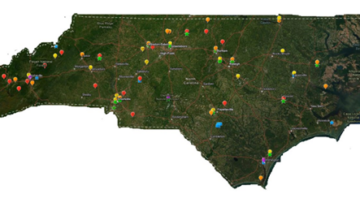
By Corey Davis and Bradley McLambThis post originally appeared on the State Climate Office’s Climate Blog in August 2021 coinciding with the public launch of the Ambient Information Reporter. The State Climate Office... |Air Quality Blog
By Heather WylieA Statewide Effort Last month we discussed the National Ambient Air Quality Standards (NAAQS), but how do we measure air quality to ensure our air... |Air Quality Blog
By Heather WylieIn an earlier post, we discussed the Air Quality Index and how it measures the state of the air. We mentioned that the breakpoints for... |Air Quality Blog
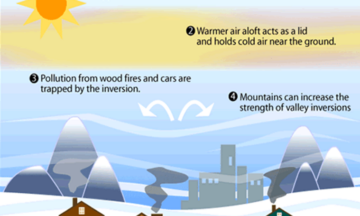
By Heather WylieIn our forecast discussion, we will occasionally mention things like “limited dispersion” or “low mixing heights” – have you ever wondered what that means? It... |Air Quality Blog
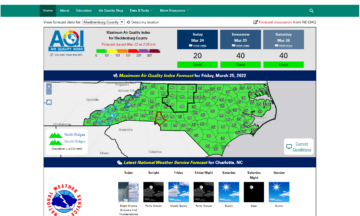
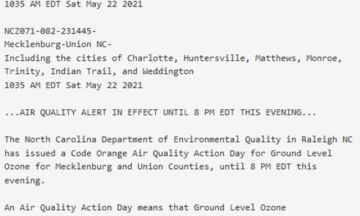
By Heather WylieOccasionally, meteorologists at the Division of Air Quality will send out an Air Quality Alert – What does that mean? In our typical day to... |Air Quality Blog
By Heather WylieThe Air Quality Index The Air Quality Index, or AQI, is a way to convey the state of air quality to the population. It is... |Air Quality Blog
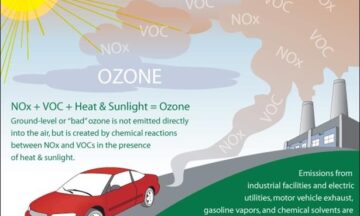
By Heather WylieTropospheric vs Stratospheric Ozone While many have heard of the ozone layer high up in the atmosphere that helps to shield the planet from solar...